Technical analysis · 2026 guide
The best indicators for indices trading depend on the question: exponential moving averages for trend direction, the relative strength index for momentum, and average true range for volatility. This 2026 guide explains six tools and their limits for traders using VCG Markets.
Key takeaways
- For trend context, exponential moving averages are a starting point among the best indicators for indices trading.
- The relative strength index measures momentum. Average true range measures volatility, not direction.
- Volume-weighted average price requires scrutiny of the volume source and session boundaries.
- VCG Markets provides index trading access. Technical indicators do not establish future returns.
01Choose by purpose
02Understand the limits
03Review consistently
01
Why indicator choice matters
Indicators transform market data. They do not add information from the future. Several indicators can agree because they reuse the same prices.
For your 2026 chart review, judge each tool against these criteria:
- Purpose: Identify whether it measures trend, momentum, volatility or volume-weighted price.
- Data source: Check the instrument, price feed and trading session.
- Responsiveness: Understand the trade-off between faster changes and greater sensitivity to short-term movement.
- Distinct contribution: Ask what the indicator adds beyond tools already displayed.
- Failure conditions: Define when the reading becomes less useful.
- Repeatability: Record settings so another review can reproduce the observation.
A useful indicator answers a defined question. Agreement alone does not validate a trade. An index chart also reflects its construction and constituents. No technical calculation explains every reason for a market move.
02
Indicators at a glance
This 2026 comparison orders indicators by their analytical role. It is not a ranking of expected returns. Start with the question you need answered.
| Indicator | Best suited to | Distinct feature | Key limitation |
| Exponential moving average | Trend direction | Weights recent prices more heavily | Lags turning points |
| Relative strength index | Momentum context | Bounded momentum scale | Extremes can persist |
| Average true range | Volatility context | Includes gaps in its range calculation | Does not show direction |
| Bollinger Bands | Relative price extension | Bands adjust with standard deviation | Band touches do not establish reversals |
| Volume-weighted average price | Session reference | Weights prices by recorded volume | Depends on volume quality |
| Average directional index | Trend strength | Separates strength from direction | Responds after price movement |
03. Exponential moving average: trend direction
The exponential moving average smooths prices while assigning greater weight to recent observations. Its slope and position relative to price provide trend context. It remains a calculation of past prices.
A 20-bar setting responds faster than a 50-bar setting on the same chart. Those are illustrative settings, not an optimum. Changing the chart interval changes the elapsed time represented.
Exponential moving average strengths:
- Makes a directional slope visible.
- Reduces the visual impact of individual price bars.
- Supports comparisons using fixed settings.
Exponential moving average limitations:
- Price crossings can alternate repeatedly in sideways conditions.
- Longer settings react more slowly to a reversal.
Best suited to: Establishing trend context before examining an entry rule. Verdict: Hold as a context tool. Skip standalone crossover conclusions.
04. Relative strength index: momentum context
The relative strength index compares smoothed gains and losses. It expresses momentum on a scale from 0 to 100. A 14-bar lookback is a conventional setting.
Readings above 70 and below 30 are commonly labelled overbought and oversold. Neither label means price must reverse. Strong trends can sustain extreme readings.
Relative strength index strengths:
- Provides a bounded momentum reference.
- Makes changes in momentum visible.
- Supports comparison between price movement and oscillator movement.
Relative strength index limitations:
- An extreme reading does not supply reversal timing.
- Divergence can persist while price continues trending.
Best suited to: Describing momentum within an already defined market context. Verdict: Hold for momentum review. Skip automatic trades at threshold readings.
05. Average true range: volatility context
Average true range measures the size of price movement rather than its direction. Its true-range calculation considers the current high and low alongside the previous close. That captures gaps between bars.
A 14-bar average true range summarises recent ranges using the indicator’s smoothing method. Its value is expressed in the instrument’s price units. It is not a forecast of the next bar’s range.
Average true range strengths:
- Distinguishes larger recent ranges from smaller ones.
- Includes gaps in the underlying calculation.
- Helps describe the volatility context of a recorded setup.
Average true range limitations:
- Rising volatility does not identify an upward or downward move.
- Historical ranges do not cap future losses or gaps.
Best suited to: Reviewing how market movement changes around a setup. Verdict: Hold for volatility context. Skip treating it as a maximum-loss estimate.
06. Bollinger Bands: relative price extension
Bollinger Bands place volatility-based boundaries around a moving average. A conventional configuration uses a 20-bar simple moving average with bands 2 standard deviations away. Settings change the display.
The bands widen as measured dispersion increases. They contract as it decreases. A price touching an outer band describes its relative position, not a guaranteed turning point.
Bollinger Bands strengths:
- Shows price relative to an adaptive envelope.
- Makes changing dispersion visible.
- Combines a central reference with upper and lower boundaries.
Bollinger Bands limitations:
- Price can remain near an outer band during a trend.
- Contracting bands do not identify the direction of a later breakout.
Best suited to: Describing price extension and volatility compression. Verdict: Hold for context. Skip treating the bands as fixed support and resistance.
07. Volume-weighted average price: session reference
Volume-weighted average price weights observations by their recorded volume. A session-based calculation resets at a defined session boundary. The result depends on both the data and that boundary.
An index level is a calculation, not a single traded security. Index-linked instruments have their own feeds. Check whether your chart supplies traded volume, tick volume or no suitable volume series.
Volume-weighted average price strengths:
- Provides a defined session reference.
- Connects the calculation to recorded volume.
- Shows price relative to that reference.
Volume-weighted average price limitations:
- Tick volume measures updates rather than traded units.
- Different session boundaries produce different readings.
Best suited to: Session analysis with an understood volume source. Verdict: Hold when the inputs are clear. Skip interpretation when volume provenance is unclear.
08. Average directional index: trend strength
The average directional index measures trend strength through smoothed directional movement calculations. Its line does not identify whether the trend is rising or falling. A rising reading can accompany either direction.
Separate strength from direction in your notes. Price structure or the accompanying directional indicators must supply directional context. Strength alone does not establish an entry.
Average directional index strengths:
- Focuses explicitly on trend strength.
- Helps separate direction from persistence.
- Provides a repeatable reading for journal comparisons.
Average directional index limitations:
- Smoothing delays its response to changing conditions.
- A strong reading does not tell you how much movement remains.
Best suited to: Assessing trend strength after direction is established separately. Verdict: Hold for regime description. Skip reading a rising line as a bullish signal.
09. Build a reviewable indicator setup
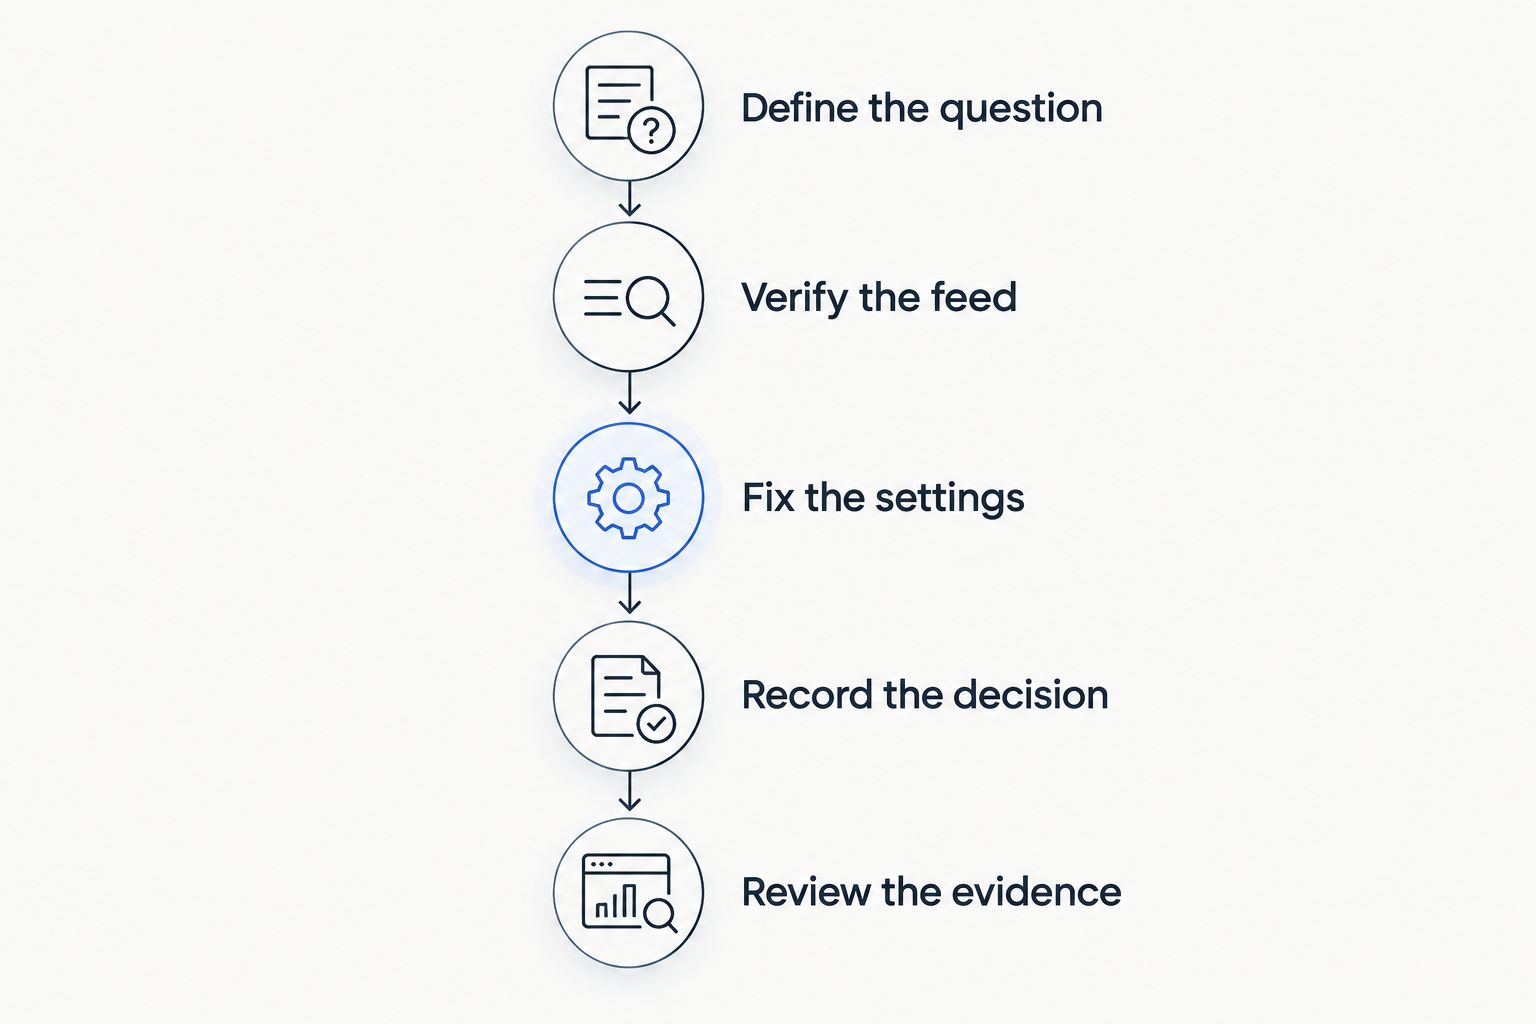
For a 2026 review, begin with a question rather than a collection of indicators. Use this sequence to make your observations reproducible:
- Define the question. Choose trend direction, momentum or volatility context.
- Verify the feed. Record the instrument, session and volume source where relevant.
- Fix the settings. Note the chart interval, calculation period and price input.
- Record the decision. Save the reading available at the time. Do not substitute a later chart.
- Review the evidence. Separate rule adherence from the financial result.
Use a pre-trade decision checklist to keep the indicator reading separate from execution and risk checks. An attractive chart does not establish an acceptable exposure.
Record the inputs before judging the result.
Change one analytical choice at a time when comparing setups. Otherwise, you cannot identify which change explains a different reading. Keep unsuccessful examples alongside successful ones.
How were these tools ordered? The sequence follows purpose, data requirements and limitations. It does not claim that one indicator produces stronger returns than another.
Which indicator should you choose?
For an undecided reader, the exponential moving average is a straightforward starting point for trend context. Add average true range only when the question concerns volatility. Choose the relative strength index when you specifically need momentum context.
Your 2026 setup should have an explanation for every indicator displayed. If two tools answer the same question, document what the second contributes.
Choose the question first. Choose the indicator second.
FAQ
What are the best indicators for indices trading?
Exponential moving averages suit trend context. The relative strength index suits momentum, while average true range suits volatility. None establishes future returns.
Does an overbought reading mean an index will fall?
No. An overbought reading describes the oscillator's calculation, not a required reversal. Strong trends can maintain extreme readings.
Which indicator shows whether an index will rise?
No indicator establishes whether an index will rise. Trend and momentum tools summarise observed market data rather than future outcomes.
Can I use volume-weighted average price on an index chart?
Only interpret volume-weighted average price after checking the chart's volume source. An index level has no single directly traded volume series. An index-linked instrument can provide a different dataset.
Are moving average settings measured in minutes?
Moving average settings normally refer to bars, not fixed minutes. A 20-bar setting represents different elapsed time on different chart intervals.
Does average true range define a safe stop distance?
No. Average true range describes historical movement and does not cap future price changes. Gaps and execution conditions remain separate risks.
Does VCG Markets access replace the need to review indicators?
No. VCG Markets provides market access, while indicator selection remains an analytical decision. Record your settings and assess each tool's limitations separately.
One last thing
Check whether a signal uses the current bar or a completed bar. The current bar’s values continue changing until it closes. A screenshot taken later can therefore show a different reading from the one available during your decision.
Record the observation time and bar status. Without them, an apparently identical chart setup can describe a different moment.
Related guides
This article is for educational purposes only and does not constitute investment advice. Trading CFDs and other leveraged products carries a high level of risk and may not be suitable for all investors.


