ماڵپەڕBest technical indicators for CFD trading
Best technical indicators for CFD trading
Oct 5, 2026
Best overall for trend direction: the exponential moving average. Best for momentum: the Relative Strength Index. Best for volatility: Average True Range. This 2026 guide compares the best technical indicators for CFD trading by the question each answers, not by promises of profitable signals.
TL;DR
- The best technical indicators for CFD trading serve different jobs: EMA for trend, RSI for momentum, ATR for volatility.
- Bollinger Bands describe relative price position. MACD tracks momentum changes. ADX measures trend strength, not direction.
- VCG Markets provides multi-asset market access. Indicators support chart analysis but do not remove CFD trading risk.
- Choose indicators with distinct roles. Adding overlapping signals does not create independent confirmation.
Why this matters
An indicator transforms price data. It does not know what happens next. A clean signal still leaves questions about exposure, execution and the amount you can lose.
At VCG Markets, traders access multiple asset classes through CFDs. That makes the distinction important: a chart describes the underlying price. Your trading result also depends on the contract, financing terms and execution.
VCG Markets suits traders seeking multi-asset market access with MT5 chart analysis. That platform access is useful. It does not turn an indicator into a forecast or make CFD trading equivalent to owning the underlying asset.
For a 2026 indicator shortlist, separate three questions. Is price trending? Is momentum changing? How much is price moving? Those questions deserve different tools.
What makes the best technical indicators for CFD trading?
Use these criteria before choosing a chart layout:
- Trend: Does the indicator describe direction, strength or both?
- Momentum: Does it reveal changes in the pace of price movement?
- Volatility: Does it measure movement in a form you can interpret?
- Clarity: Can you explain the calculation and what the output means?
- Limitations: Do you understand when its signals become misleading?
- Distinct role: Does it add information rather than repeat another indicator?
A moving average and MACD both use moving averages. Agreement between them is not the same as agreement between unrelated sources of evidence. More panels do not automatically mean more information.
Technical indicators at a glance
The 2026 shortlist below gives each indicator a separate job. The order reflects usefulness for building a readable analytical framework. It is not a ranking of expected returns.
Exponential moving average
- Best for: Trend direction
- Standout feature: Gives greater weight to recent prices
- Key limitation: Lags price and produces repeated crosses in ranges
Relative Strength Index
- Best for: Momentum context
- Standout feature: Bounded scale from 0 to 100
- Key limitation: Extreme readings can persist during trends
Average True Range
- Best for: Volatility measurement
- Standout feature: Includes gaps in its range calculation
- Key limitation: Gives no directional signal
Bollinger Bands
- Best for: Relative price position
- Standout feature: Bands expand and contract with volatility
- Key limitation: A band touch is not a reversal signal
MACD
- Best for: Momentum transitions
- Standout feature: Compares moving averages and their signal line
- Key limitation: Overlaps with moving-average analysis
Average Directional Index
- Best for: Trend-strength assessment
- Standout feature: Separates strength from direction
- Key limitation: Rising strength does not identify bullish direction
1. Exponential moving average: best for trend direction
An exponential moving average, or EMA, smooths price data. It gives recent observations more weight than older ones. Its slope helps you describe direction without treating every candle as a new trend.
A 20-period EMA uses a different horizon from a 50-period EMA. On a daily chart, those periods represent daily bars. On an hourly chart, they represent hourly bars. The same setting does not describe the same elapsed time across charts.
EMA pros:
- Makes the prevailing direction easier to read.
- Responds more quickly than a simple moving average with the same period.
- Provides a consistent reference for describing price position.
EMA cons:
- Uses past prices, so it follows rather than predicts movement.
- Produces frequent crossings when price moves sideways.
- Its apparent usefulness changes with the selected horizon.
Do not treat a move above an EMA as proof of a new upward trend. Inspect the slope and the surrounding price structure. A flat average with repeated crossings describes something different from a steadily rising average.
Best for: Traders who need a simple trend-direction reference before adding other indicators.
Verdict: Hold the EMA as a trend reference. Skip standalone crossover decisions.
2. Relative Strength Index: best for momentum context
The Relative Strength Index, or RSI, compares average upward and downward price changes. It expresses their relationship on a scale from 0 to 100. A common calculation uses 14 periods.
The familiar 70 and 30 levels mark conventional overbought and oversold zones. They are labels, not instructions. A strong upward trend can keep RSI elevated while price continues rising.
RSI pros:
- Uses a bounded scale that is easy to compare across observations.
- Helps describe the balance of recent upward and downward movement.
- Makes momentum shifts visible alongside price structure.
RSI cons:
- Extreme readings do not establish that a reversal is imminent.
- Divergence can persist without producing the expected price response.
- Shorter settings create more sensitive, noisier readings.
An RSI divergence means price and the indicator are not making matching extremes. It does not explain why. Treat it as a reason to examine the chart, not as confirmation that the market must turn.
Keep your interpretation consistent. Changing settings whenever a signal disappoints makes it harder to compare one observation with another.
Best for: Traders who want momentum context within an already identified market structure.
Verdict: Hold RSI for momentum analysis. Skip automatic decisions at 70 or 30.
3. Average True Range: best for volatility measurement
Average True Range, or ATR, measures the size of price movement. Its true-range calculation accounts for the current high and low plus gaps from the previous close. A common smoothing period is 14 bars.
ATR is expressed in price units. It does not tell you whether the next move is upward or downward. A rising reading indicates larger measured ranges, not bullish sentiment.
ATR pros:
- Adds volatility information that a trend line cannot provide.
- Includes gaps that a high-minus-low calculation misses.
- Helps compare current movement with the instrument's own recent history.
ATR cons:
- Does not identify direction or entry timing.
- Raw readings are not directly comparable across differently priced instruments.
- Reacts after larger ranges have entered the calculation.
An ATR-based distance is a measurement choice. It is not protection against loss. Gaps and execution conditions can produce an exit beyond a selected stop level.
When comparing instruments, keep the units visible. An ATR reading without its instrument and timeframe is incomplete. For your 2026 chart template, label both rather than copying a distance from another market.
Best for: Traders who need to describe changing price ranges separately from direction.
Verdict: Hold ATR as a volatility measure. Skip directional interpretations.
4. Bollinger Bands: best for relative price position
Bollinger Bands place an upper and lower band around a moving average. The bands use standard deviation to reflect price dispersion. A common configuration uses a 20-period simple moving average and bands set two standard deviations away.
The bands widen as measured dispersion increases. They narrow as it decreases. Their main use here is showing where price sits relative to its recent distribution.
Bollinger Bands pros:
- Combines relative price position and changing dispersion in one display.
- Makes periods of narrowing bands easy to identify.
- Provides context for movement away from the central average.
Bollinger Bands cons:
- Touching an outer band does not establish a reversal.
- Narrow bands do not identify the direction of a subsequent move.
- Standard-deviation bands do not guarantee that price stays inside them.
Price can remain near an outer band during a trend. Calling every upper-band touch expensive mistakes relative position for an instruction to sell.
A squeeze describes contraction. It does not supply a directional forecast. Examine what price actually does after contraction rather than assigning direction in advance.
Best for: Traders comparing current price with its recent range of variation.
Verdict: Hold Bollinger Bands for relative context. Skip automatic band-touch reversals.
5. MACD: best for momentum transitions
Moving Average Convergence Divergence, or MACD, compares a faster EMA with a slower EMA. A signal line smooths that difference. The histogram shows the distance between the MACD line and the signal line.
Common settings use 12-period and 26-period EMAs with a 9-period signal line. These are conventional settings. They are not evidence of an optimal configuration for your instrument.
MACD pros:
- Makes the relationship between faster and slower averages visible.
- Shows changes in that relationship through the histogram.
- Offers a consistent framework for describing momentum transitions.
MACD cons:
- Inherits the lag of its moving-average inputs.
- Produces repeated crossings in sideways conditions.
- Adds limited independence when your chart already relies on EMA signals.
A shrinking positive histogram means the MACD line is moving closer to its signal line. It does not necessarily mean price is falling. The distinction matters when interpreting slowing upward momentum.
Choose MACD because you want to inspect that relationship. Do not add it just to count another confirmation alongside an EMA crossover.
Best for: Traders studying changes in the relationship between short- and longer-horizon momentum.
Verdict: Hold MACD for momentum transitions. Skip counting it as independent EMA confirmation.
6. Average Directional Index: best for trend-strength assessment
The Average Directional Index, or ADX, measures trend strength. It belongs to the directional movement system. ADX itself does not tell you whether the trend is upward or downward.
The associated positive and negative directional indicators provide directional context. Keep those roles separate. A rising ADX can accompany either a rising or falling market.
ADX pros:
- Separates the question of trend strength from direction.
- Helps describe strengthening or weakening directional movement.
- Adds a different question to a chart focused on price position.
ADX cons:
- Does not supply direction on its own.
- Responds with delay because its calculation uses smoothing.
- A single threshold does not define every instrument's market condition.
Read ADX alongside price structure. If the line rises while price falls, the reading can describe a strengthening downward trend. It is not a contradiction.
Avoid treating a threshold crossing as a universal switch between usable and unusable markets. The instrument and chart horizon still matter.
Best for: Traders checking whether directional movement is strengthening or weakening.
Verdict: Hold ADX for trend strength. Skip reading rising ADX as bullish direction.
How we ranked
This ranking uses the six criteria above. EMA comes first because it answers the basic direction question with a readable display. RSI and ATR add momentum and volatility context. The remaining indicators answer more specific questions.
The ranking evaluates analytical roles and limitations. It does not claim tested profitability. No indicator earns a higher position because it has more settings or produces more signals.
Which indicators should you choose?
Start with one question per indicator: EMA for trend, RSI for momentum and ATR for volatility. This is a chart-analysis framework, not a trading recommendation. You can also leave an indicator out when price structure already answers your question.
- Trend: Use EMA to describe direction and price position.
- Momentum: Use RSI to describe recent upward versus downward movement.
- Volatility: Use ATR to describe the size of recent price ranges.
Keep that division explicit in your 2026 review notes. Record what each indicator showed before the outcome was known. Otherwise, hindsight makes almost any chart look persuasive.
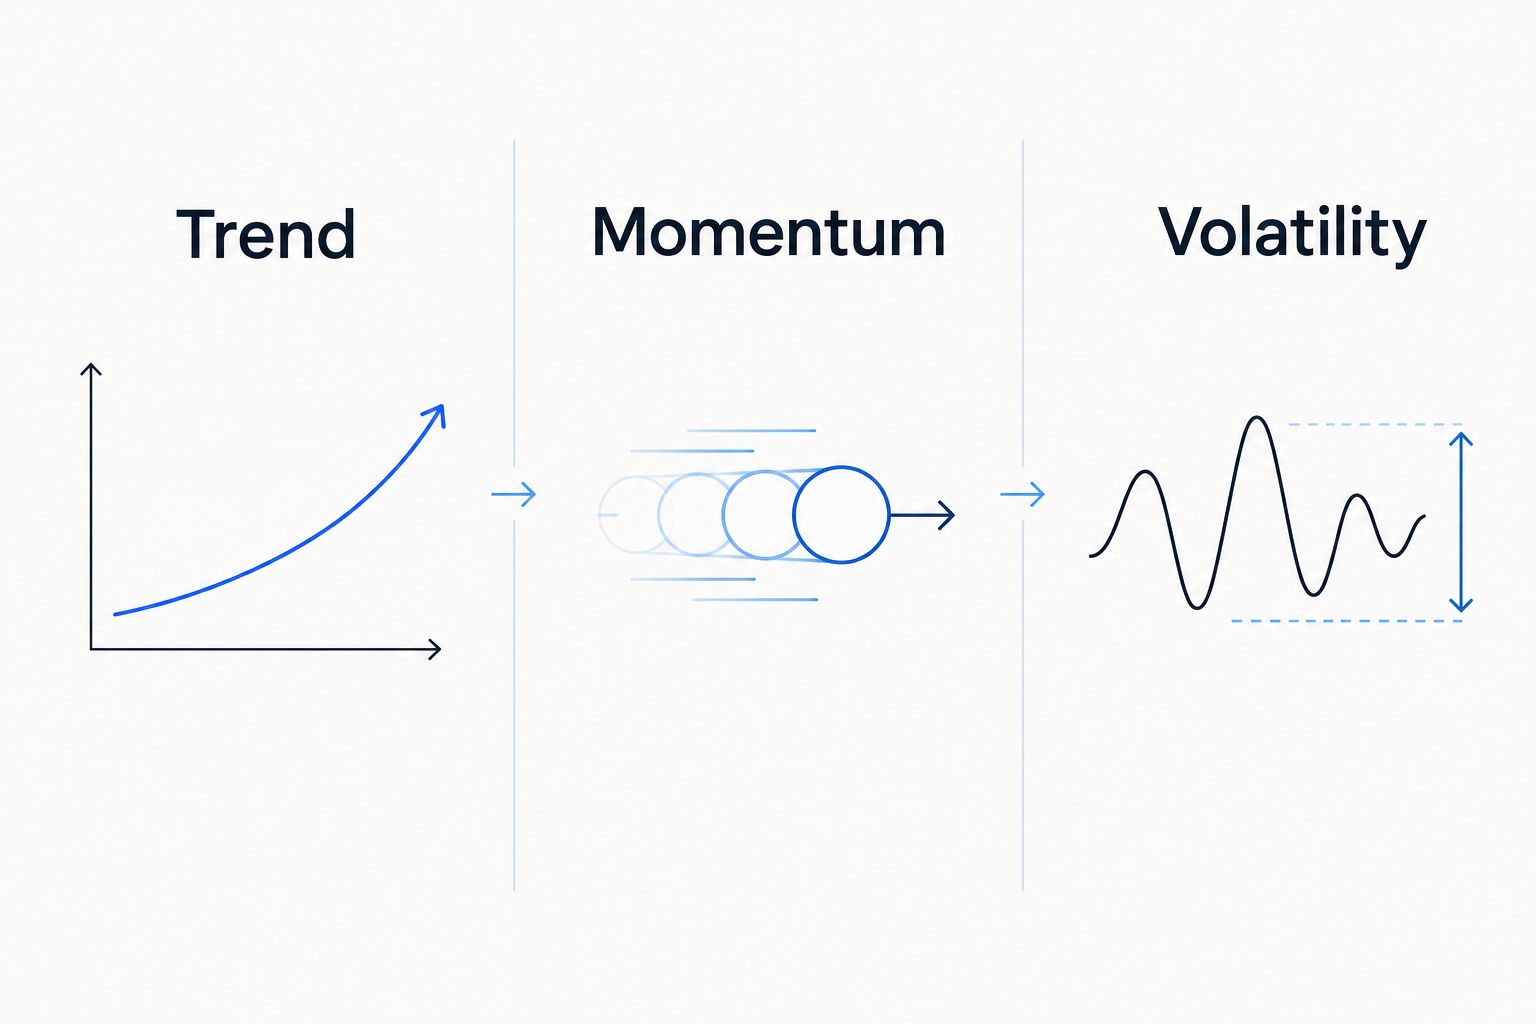
Separate analytical roles before adding more indicators.
VCG Markets offers MT5 access alongside its multi-asset offering. Chart access supports analysis, but it does not establish a trading edge. The limit remains the same across platforms: indicators describe data and cannot guarantee future results.
FAQ
What are the best technical indicators for CFD trading in 2026?
EMA, RSI and ATR provide a clear starting framework for trend, momentum and volatility analysis. Bollinger Bands, MACD and ADX answer more specific questions. None guarantees profitable trades.
Is RSI better than MACD for CFD trading?
RSI and MACD answer different momentum questions. RSI compares upward and downward price changes on a bounded scale. MACD compares moving averages and their signal line.
Does an RSI reading above 70 mean I should sell?
No. An RSI reading above 70 marks a conventional overbought zone, not a sell instruction. Strong trends can sustain elevated readings.
Can ATR tell me which direction price will move?
No. ATR measures price-range size and includes gaps in its calculation. It does not identify whether the next move will be upward or downward.
Are Bollinger Band touches reliable reversal signals?
A Bollinger Band touch is not a standalone reversal signal. Price can remain near an outer band during a trend. Narrow bands also do not predict breakout direction.
Should I use EMA and MACD together?
Use both only when each answers a distinct analytical question. MACD already uses EMAs, so agreement between them is not independent confirmation.
Does VCG Markets provide technical chart analysis tools?
VCG Markets provides MT5 access and native TradingView integration. These support chart analysis across its multi-asset offering. Platform tools do not remove CFD trading risk.
One last thing
Two indicators can agree because they share inputs, not because a trade is more certain. Before adding another panel, name the new question it answers. If you cannot, keep the chart simpler.
For your next review, preserve the original settings and record the interpretation before looking at the result. That makes the analysis inspectable. A convincing chart after the event is not the same as a useful decision process.

زانیاری
VCG Markets Ltd ئەو دامەزراوەیە کە مۆڵەتی پێدانی خزمەتگوزاریەکانی وەبەرهێنانی هەیە. لە کۆماری موریتیووس تۆمار کراوە (ژمارەی کۆمپانیا 188485) و لەژێر مۆڵەتی ژمارە GB22200388 دەستوور و ڕێکخراوی هەیئەتی خزمەتگوزاریەکانی دارایی موریتیووسە، و نووسینگەی تۆمارکراوی لە The Cyberaty Lounge، نهۆمی زەوی، The Catalyst، Silicon Avenue، 40 Cybercity، 72201 Ebene، کۆماری موریتیووس.
VCG Markets (Seychelles) Ltd ئەو دامەزراوەیە کە مۆڵەتی پێدانی خزمەتگوزاریەکانی کڕین و فرۆشتنی بازاڕی بورس (Securities Dealer) هەیە. لە کۆماری سیشێل تۆمار کراوە (ژمارەی کۆمپانیا 8438443-1) و لەژێر مۆڵەتی ژمارە SD243 دەستوور و ڕێکخراوی دەزگای خزمەتگوزاریە داراییەکانی سیشێلە، و نووسینگەی تۆمارکراوی لە House of Francis، Room 301(B)، Ile Du Port، Mahe، کۆماری سیشێل.
ماڵپەڕەکە بەڕێوەدەبرێت لەلایەن VCG Tech Limited (ژمارەی کۆمپانیا HE452446)، و نووسینگەی تۆمارکراوی لە Agias Fylaxeos & Zinonos Rossidi، 2، نهۆمی یەکەم، 3082 لیماسۆڵ، قیبرەسە. VCG Tech Limited وەک کۆمپانیای بازرگانی بۆ پرۆسەکردنی وەرگرتن و دەرکردنی دراوی کڕیارەکان کار دەکات.
داودەدانی فۆرێکس و CFD بە مارجین بەرهەمە بە ئاستی بەرزی بەرزبوون و دەکرێت زیانەکان لە واریزکردنەکانت تێبپەڕێت. نرخی وەبەرهێنانەکان دەکرێت بکەوێت و بهەڵبێت، و دەکرێت کەمتر لە پارەی خۆت وەری بگرێتەوە. تکایە بتوانیت مەترسیەکانی تێکەڵبوون بۆ تەواوی تێبگەیت و بیپرسیتەوە ئایا ئەم شێوەی داودەدان گونجاوە بۆت.
لەوانەیە پەیوەندییە تەلەفۆنییەکان و پەیوەندییە ئەلیکترۆنییەکان تۆمار بکرێن و چاودێریان بکرێت بۆ مەبەستی دڵنیاکردنەوە لە کوالیتی، گونجانی، و مەبەستی ڕاهێنان.
زانیاریەکانی ئەم ماڵپەڕە تەنها بۆ مەبەستی زانیارییەکانی گشتی دابینکراوە و پێکناهێنێت ئامۆژگاری وەبەرهێنانی، پێشنیارێک، یان داواکردنێکی بەژداری لە هەر چالاکییەکی وەبەرهێنانی.
VCG Markets هیچ ئامۆژگاری باجی پێشکەش ناکات. یاسای باج دەکرێت بگۆڕێت یان لە نێوان دادگایی جیاجیا جیاوازی هەبێت.
زانیاریەکانی ئەم ماڵپەڕە مستەقیم نییە بۆ نیشتەجێبووانی ئەمریکای یەکگرتوو، بەلجیکا، کەنەدا، سینگاپور، یان هەر دادگایێک کە دەستگەیشتن بە ئەم زانیاریانە دژ بە یاسا یان ڕێنمایییە خۆجێیەکانی ئەمجایەبێت.
VCG Markets © 2026, Inc. هەموو مافەکان پارێزراوە.

فۆڵۆومان بکەن


