HomeWhy market correlations change during periods of stress
Why market correlations change during periods of stress
Oct 20, 2026
Market correlations change during stress because shared pressures can outweigh the forces that normally move each asset separately. Forced selling, demand for cash and changing expectations can make previously different positions move together. That weakens diversification precisely when you expect separate exposures to provide protection.
TL;DR
- Why market correlations change: shared funding pressures can overwhelm differences between individual assets.
- Stocks, bonds and gold do not have fixed relationships. The shock and measurement window matter.
- Correlation describes co-movement. It does not explain the cause or measure potential losses.
- VCG Markets offers multi-asset trading. Access to different markets does not itself create diversification.
Shared shocks · Cash pressure · Exposure checks
01. Why market correlations change during periods of stress
Market correlations change when the balance of forces moving prices changes. In quieter conditions, company earnings can dominate a share price while supply conditions dominate oil. During stress, both positions can respond to the same urgent need to raise cash.
A correlation is a description of a particular sample, not a permanent relationship between assets. A relationship measured before a shock does not establish how those assets will behave during it.
For traders using a multi-asset broker such as VCG Markets, that distinction matters. Different market labels do not necessarily mean different underlying risks.
The following comparison shows how distinct drivers can give way to common pressure. These are mechanisms, not forecasts for every episode of stress.
Shares and oil
- Separate drivers: Company earnings and physical supply
- Shared stress pressure: Weaker growth expectations
- Diversification limit: Both can respond to deteriorating demand
Shares and government bonds
- Separate drivers: Earnings and interest-rate expectations
- Shared stress pressure: Inflation or policy repricing
- Diversification limit: Bond prices do not always offset falling shares
Shares and gold
- Separate drivers: Corporate prospects and monetary conditions
- Shared stress pressure: Demand for cash
- Diversification limit: Gold can face selling alongside shares
Different equity indices
- Separate drivers: Constituent businesses and sector weights
- Shared stress pressure: Broad equity selling
- Diversification limit: Different indices can contain overlapping exposures
The useful question in 2026 is not simply whether two markets were correlated. It is whether the same pressure now dominates both.
Why this matters
A portfolio can contain several instruments but still depend on one economic outcome. Shares, an equity index and a growth-sensitive commodity can all carry exposure to economic activity.
Counting positions misses that overlap. Understanding their drivers makes it visible.
Diversification remains useful. Its limit is that relationships between positions can change. Treating yesterday’s correlation as a fixed property hides that limit.
02. What correlation tells you, and what it leaves out
Correlation measures how returns move together over a selected sample. It does not measure how similar the assets look or whether their prices are close.
The standard Pearson correlation coefficient runs from −1 to +1:
- +1: A perfect positive linear relationship within the sample.
- 0: No linear relationship within the sample.
- −1: A perfect negative linear relationship within the sample.
Those values describe a statistical relationship. They are not probabilities that a position will rise or fall.
A positive correlation also does not mean two positions move by the same amount. One can experience a much larger price move than the other. That difference matters when assessing the size of a potential offset.
A reading near zero does not prove independence. Nonlinear relationships can exist even when linear correlation is weak. A relationship can also differ between ordinary sessions and unusually large moves.
Correlation is not a loss estimate. Position size, volatility, leverage and execution conditions determine how co-movement translates into account exposure.
For a correlation review in 2026, keep those questions separate. First ask how the returns relate. Then ask what their joint movement would mean for the positions you actually hold.
03. Why shared pressures change market relationships
Several mechanisms explain why market correlations change. They can operate together. None establishes that every asset must move in the same direction during every crisis.
- Cash demand. Investors seeking cash can sell otherwise unrelated holdings. The immediate decision concerns funding needs rather than each asset’s long-term outlook.
- Forced selling. Margin requirements and risk limits can require exposure reductions. A position can be sold because it is accessible rather than because its underlying prospects changed.
- Liquidity conditions. When trading depth falls, sell orders can have greater price impact. Pressure across several markets can make their movements more closely aligned.
- Common repricing. A change in growth, inflation or interest-rate expectations can affect several asset classes together. The direction depends on the shock.
- Overlapping exposure. Different instruments can contain the same securities or depend on the same economic driver. Stress can reveal connections that market labels conceal.
These mechanisms distinguish a market relationship from an economic explanation. A correlation reading shows the result. It does not identify which pressure caused it.
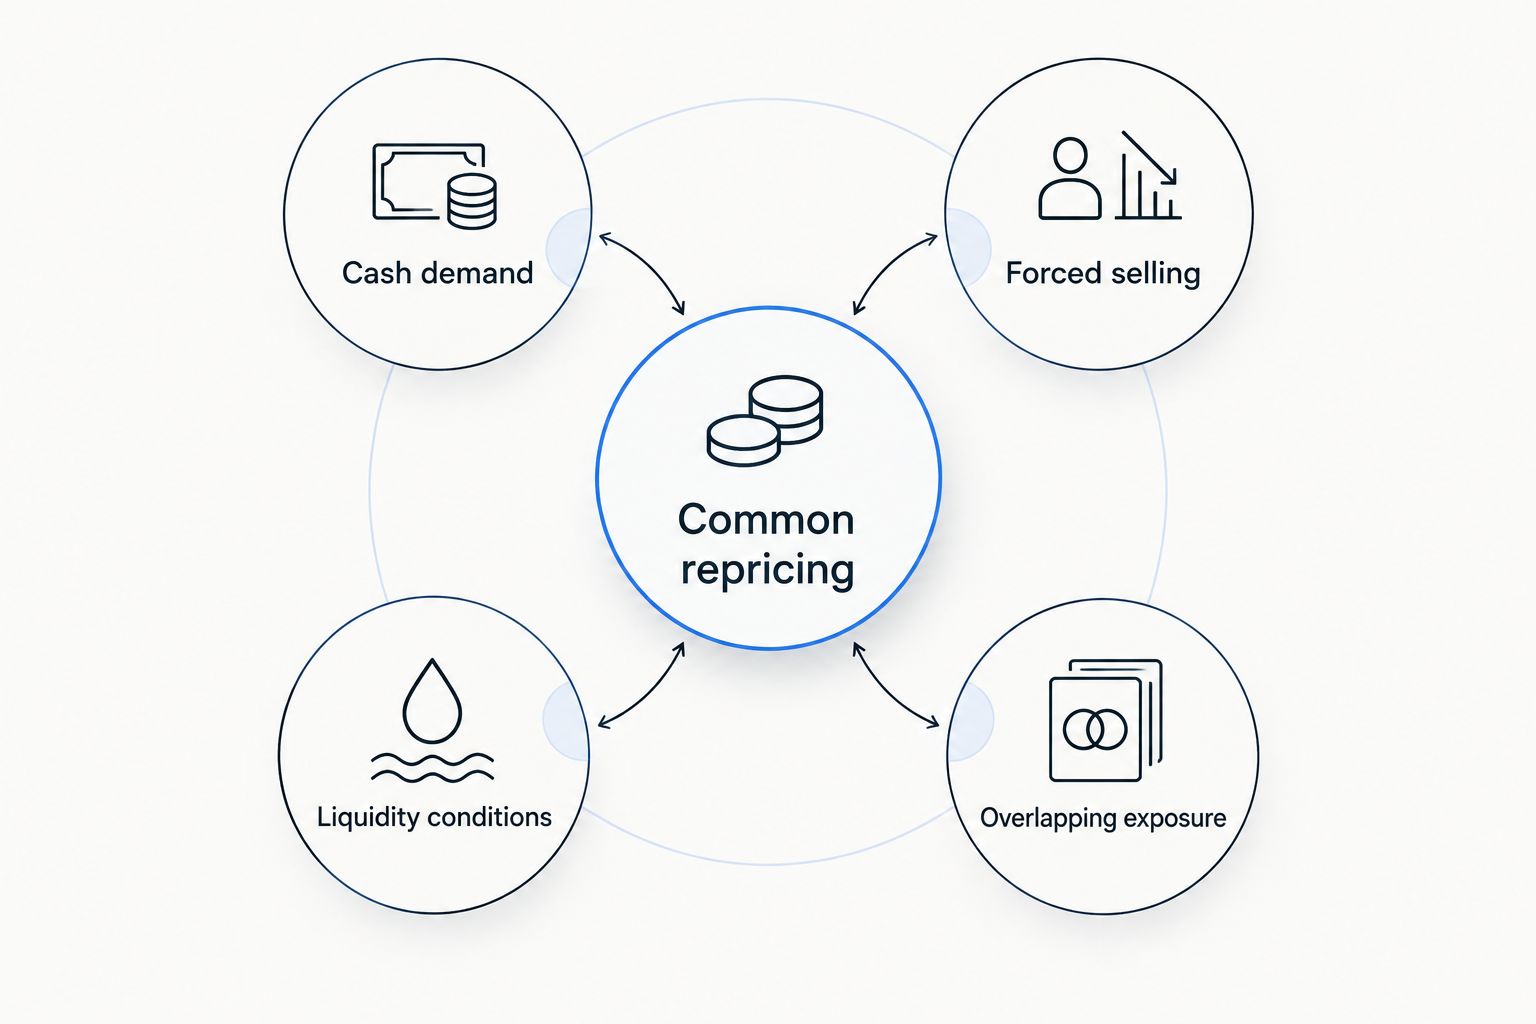
Different assets can respond to the same pressure even when their usual drivers differ.
A useful explanation names the actual channel. Saying that markets became nervous is less informative than identifying a funding squeeze or a change in inflation expectations.
04. Why shares and bonds do not always offset each other
Shares and government bonds respond to different combinations of earnings, interest rates and inflation. Their relationship depends on which combination dominates.
A weakening growth outlook can reduce expected corporate earnings. At the same time, expectations of lower policy rates can support government bond prices. Under that mechanism, their movements can offset each other.
An inflation shock creates a different problem. Higher required yields put downward pressure on existing bond prices. Higher discount rates can also weigh on equity valuations. Shares and bonds can then fall together.
Weaker growth expectations
- Potential equity response: Earnings expectations weaken
- Potential government bond response: Lower expected rates support prices
- What to examine: Whether inflation allows that rate response
Higher inflation expectations
- Potential equity response: Valuations and margins face pressure
- Potential government bond response: Higher required yields reduce prices
- What to examine: Inflation sensitivity and bond duration
Urgent cash demand
- Potential equity response: Holdings face liquidation
- Potential government bond response: Liquid holdings can also be sold
- What to examine: Funding pressure rather than labels
These are conditional relationships. They do not establish what prices will do next.
The reason for the shock matters more than the assumption that bonds always hedge shares. For a 2026 review, distinguish growth risk from inflation risk before interpreting an observed correlation.
05. Why gold and oil need separate explanations
Gold and oil are both commodities. That classification does not give them the same economic role.
Gold responds to factors including real interest rates, currency movements and demand for stores of value. Oil responds to physical supply, demand and inventory conditions. Both also trade within financial markets where funding pressure matters.
Gold
- Relevant drivers: Real rates, currency movements and investment demand
- Potential diversification role: Exposure to drivers beyond corporate earnings
- Limitation: Cash demand can still trigger selling
Oil
- Relevant drivers: Supply, demand and inventories
- Potential diversification role: Exposure to physical energy conditions
- Limitation: Growth weakness can affect oil and shares together
Gold’s defensive role is conditional. An investor needing cash can sell gold even while remaining concerned about the wider outlook. A falling gold price during stress does not, by itself, identify the underlying cause.
Oil also requires a clear diagnosis. A supply disruption differs from a demand contraction. Both can create market stress, but their effects on oil and other assets need not match.
The practical distinction is simple: classify the shock before interpreting the relationship. A broad commodity label cannot replace that work.
06. Why different indices can carry similar risks
Different index names do not guarantee independent exposure. Indices can share constituents or concentrate weight in similar sectors.
Weighting matters. A capitalisation-weighted index gives larger companies greater influence. If several indices depend heavily on similar businesses, their returns can reflect the same valuation pressures.
The guide to index weighting and market performance explains why construction matters when interpreting index moves.
The benefit of holding different indices is access to different baskets of securities. The limitation is that the baskets can overlap. Their economic sensitivities can overlap even when their constituents do not.
For a 2026 exposure check, examine both the holdings and the drivers. Sector concentration, interest-rate sensitivity and exposure to economic activity can connect positions that appear separate on a watchlist.
A position list answers what you hold. It does not fully answer what could move those holdings together.
07. How should you check whether a correlation has changed?
Start with comparable return series. Then investigate whether the observed change reflects the market relationship or the measurement choices.
- Use returns. Comparing raw price levels can produce misleading relationships. Returns describe changes over the selected interval.
- Align timestamps. Assets that close at different times can record the same news in different observations. Check that the series cover comparable periods.
- Match intervals. A 1-day return and a 1-week return answer different questions. Keep the interval consistent across assets.
- Compare windows. A shorter sample responds faster to recent changes. It also contains fewer observations. A longer sample can blend different market conditions.
- Check currency. Converting an asset into your account currency introduces exchange-rate effects. Separate those effects from movement in the underlying market.
- Inspect exposure. Review position direction, size and sensitivity. The same asset correlation has different implications for different portfolios.
Do not treat a single updated reading as proof of a permanent change. Look for an explanation that matches the timing and the market mechanism.
A useful 2026 review records the return interval, sample window and currency alongside the result. Without those details, two correlation readings can appear contradictory while measuring different things.
Can correlations change without a financial crisis?
Yes. Changes in policy expectations, index composition or supply conditions can alter relationships without a broad crisis. Stress makes shared pressures more visible, but it is not required for correlations to change.
Does a higher correlation always mean higher risk?
No. Correlation alone does not determine risk. Volatility, exposure direction and position size also matter. A strong relationship between small positions can have different consequences from the same relationship between large leveraged positions.
The VCG Markets lens
VCG Markets offers multi-asset trading for traders who want access to different financial markets. Access expands the set of exposures you can examine. It does not establish that those exposures offset each other.
The distinction belongs at the centre of a correlation review. Market access is a platform capability. Diversification depends on how the selected positions behave together.
Keep the analysis tied to the account. A strong statistical relationship is not a trading instruction. A weak historical relationship is not protection against future losses.
FAQ
Why do market correlations change during stress?
Market correlations change during stress because common pressures can outweigh asset-specific drivers. Cash demand, forced selling and changes in growth or inflation expectations can move otherwise different assets together.
Do all assets become positively correlated during a crisis?
No. Assets do not all become positively correlated during every crisis. The shock, funding conditions and measurement window determine the observed relationship.
Why can shares and bonds fall at the same time?
Shares and bonds can fall together when inflation or rising required yields pressure both markets. Urgent demand for cash can also create selling across asset classes.
Does gold always move against shares?
No. Gold does not have a fixed inverse relationship with shares. Real interest rates, currency movements and cash demand can change how the two markets move together.
Does zero correlation mean two assets are independent?
No. Zero correlation means no linear relationship in the selected sample. Nonlinear dependence or different behaviour during extreme moves can still exist.
Should I use daily or weekly returns to measure correlation?
Use a consistent return interval that matches the question you are examining. Daily and weekly returns capture different patterns, so do not compare their correlation readings as if they were identical.
Does holding several markets guarantee diversification?
No. Several markets can share the same underlying exposure. Check common drivers, position sizes and liquidity rather than relying on the number of instruments held.
Conclusion
Why market correlations change comes down to changing drivers. A funding squeeze, an inflation shock and a growth slowdown do not create the same relationships.
Review the shared pressure before relying on the historical offset. Correlation helps describe exposure. It cannot guarantee diversification or predict the next price move.
One final check: write the main driver beside each open position. If the same explanation appears repeatedly, investigate that overlap before treating the positions as separate sources of risk.
Related guides
This article is for educational purposes only and does not constitute investment advice. Trading CFDs and other leveraged products carries a high level of risk and may not be suitable for all investors.

Information
VCG Markets Ltd is the licensed entity authorised to provide investment services. It is incorporated in the Republic of Mauritius (Company No. 188485) and authorised and regulated by the Financial Services Commission of Mauritius under Licence No. GB22200388, with its registered office at The Cyberaty Lounge, Ground Floor, The Catalyst, Silicon Avenue, 40 Cybercity, 72201 Ebene, Republic of Mauritius.
VCG Markets (Seychelles) Ltd is the licensed entity authorised to provide Securities Dealer services. It is incorporated in the Republic of Seychelles (Company No. 8438443-1) and authorised and regulated by the Financial Services Authority of Seychelles under Licence No. SD243, with its registered office at House of Francis, Room 301(B), Ile Du Port, Mahe, Republic of Seychelles.
The website is operated by VCG Tech Limited (Company No. HE452446), with its registered office at Agias Fylaxeos & Zinonos Rossidi, 2, 1st Floor, 3082 Limassol, Cyprus. VCG Tech Limited acts as the merchant company for the processing of client deposits and withdrawals.
Margined Forex and CFD trading are leveraged products and may result in losses exceeding your deposits. The value of investments may fall as well as rise, and you may receive back less than your original investment. Please ensure you fully understand the risks involved and consider whether such trading is suitable for you.
Telephone calls and electronic communications may be recorded and monitored for quality assurance, compliance, and training purposes.
The information on this website is provided for general informational purposes only and does not constitute investment advice, a recommendation, or a solicitation to engage in any investment activity.
VCG Markets does not provide tax advice. Tax law may change or differ between jurisdictions.
The information on this website is not directed at residents of the United States of America, Belgium, Canada, Singapore, or any jurisdiction where access to such information would be contrary to local law or regulation.
VCG Markets © 2026, Inc. All rights reserved.


