Trading performance
A high trading win rate can hide larger losses because winning frequency does not measure the size of each result. Your account loses money when total losses and trading costs exceed total gains. Reviewing average wins, average losses and net results together gives you a clearer explanation than win rate alone.
Key takeaways
- High win rate losing money? Compare average wins, average losses and trading costs before judging profitability.
- Win rate measures frequency. Expectancy measures the average result per trade.
- VCG Markets supports behavioural review through VCG ONE. Performance scores do not establish profitability.
- Use closed trades for realised results. Review open losses separately through account equity.
01Frequency versus size
02Costs and exposure
03A consistent review
01
Why can a high trading win rate hide larger losses?
Win rate gives every completed trade equal weight. A small gain counts as a winner. A large loss counts as a loser. That calculation cannot tell you whether your winners paid for your losers.
Start your 2026 review with the underlying trade record. Include the realised result and position size. Add costs and entry and exit times. A review of trade holding time adds context when profitable and losing positions remain open for different lengths of time.
| Measure | Useful for | Limitation |
| Win rate | Measuring winning frequency | Does not show result size |
| Average win and loss | Comparing realised result sizes | Averages conceal individual extremes |
| Net expectancy | Measuring average net result | Describes the sample, not future returns |
Why this matters
A rising win rate is not proof of improving profitability. Closing profitable trades earlier can increase winning frequency while reducing the amount each winner contributes. You need the result distribution to distinguish more frequent wins from stronger net performance.
02
Read expectancy alongside win rate
Expectancy connects winning frequency with financial results. For a closed-trade sample, net expectancy is the total net trading result divided by the number of trades. Negative expectancy means that sample lost money on average.
Net expectancy = total net trading result ÷ completed trades.
You can also separate the calculation into winning probability multiplied by average gain, less losing probability multiplied by average loss. Use positive magnitudes for average gains and losses. Subtract average costs only when those costs are not already included in the results.
With equal-sized wins and losses, a 50% win rate breaks even before costs. If average losses exceed average wins, the required winning percentage rises above 50%. Positive trading costs raise that threshold further.
Keep the denominator consistent in your 2026 records. Decide whether a trade means a completed position or an individual execution. Splitting profitable exits into several records while counting a losing position once changes the reported win rate without changing the money earned.
03
Why results vary despite a high win rate
Separate the drivers before changing your process. The same winning percentage can accompany different financial results because trade size, realised exits and costs change what reaches your account.
- Average loss. Larger losing trades require more winning profit to offset them. Inspect the largest losses as well as the average.
- Average win. Frequent small gains contribute less than the winning percentage suggests. Compare realised gains with the exits you originally planned.
- Position size. A larger losing position can outweigh smaller winners. A count of trades does not weight financial exposure.
- Trading costs. Spreads, commissions and applicable financing affect net results. Confirm how your statement records each component.
- Open positions. Closed winners can coexist with unrealised losses. A closed-trade win rate does not describe the entire account.
- Sample composition. Different instruments, setups and review periods produce different mixes of outcomes. Keep comparisons consistent.
A 2026 review should distinguish an intended exit from an actual execution. Calculate results from actual fills. A planned stop distance describes an instruction, not a guaranteed realised loss.
04
Review the record before changing the strategy
Use a repeatable review sequence. Keep the original statement intact and perform your analysis on a separate copy. That preserves a reference when trade counts or classifications disagree.
- Define the sample. Record the review dates and instruments. State how partial exits and flat trades are counted.
- Reconcile results. Match completed positions to statement entries. Separate deposits and withdrawals from trading performance.
- Check result size. Calculate average gains and losses in the same account currency. Review the largest losing positions separately.
- Account for costs. Identify charges already included in the statement result. Add separately booked costs without counting anything twice.
- Inspect exposure. Review open positions and account equity alongside completed trades. Check whether losing positions carried larger exposure.
- Compare like with like. Group trades by a consistent setup or instrument. Record observations before drawing conclusions.
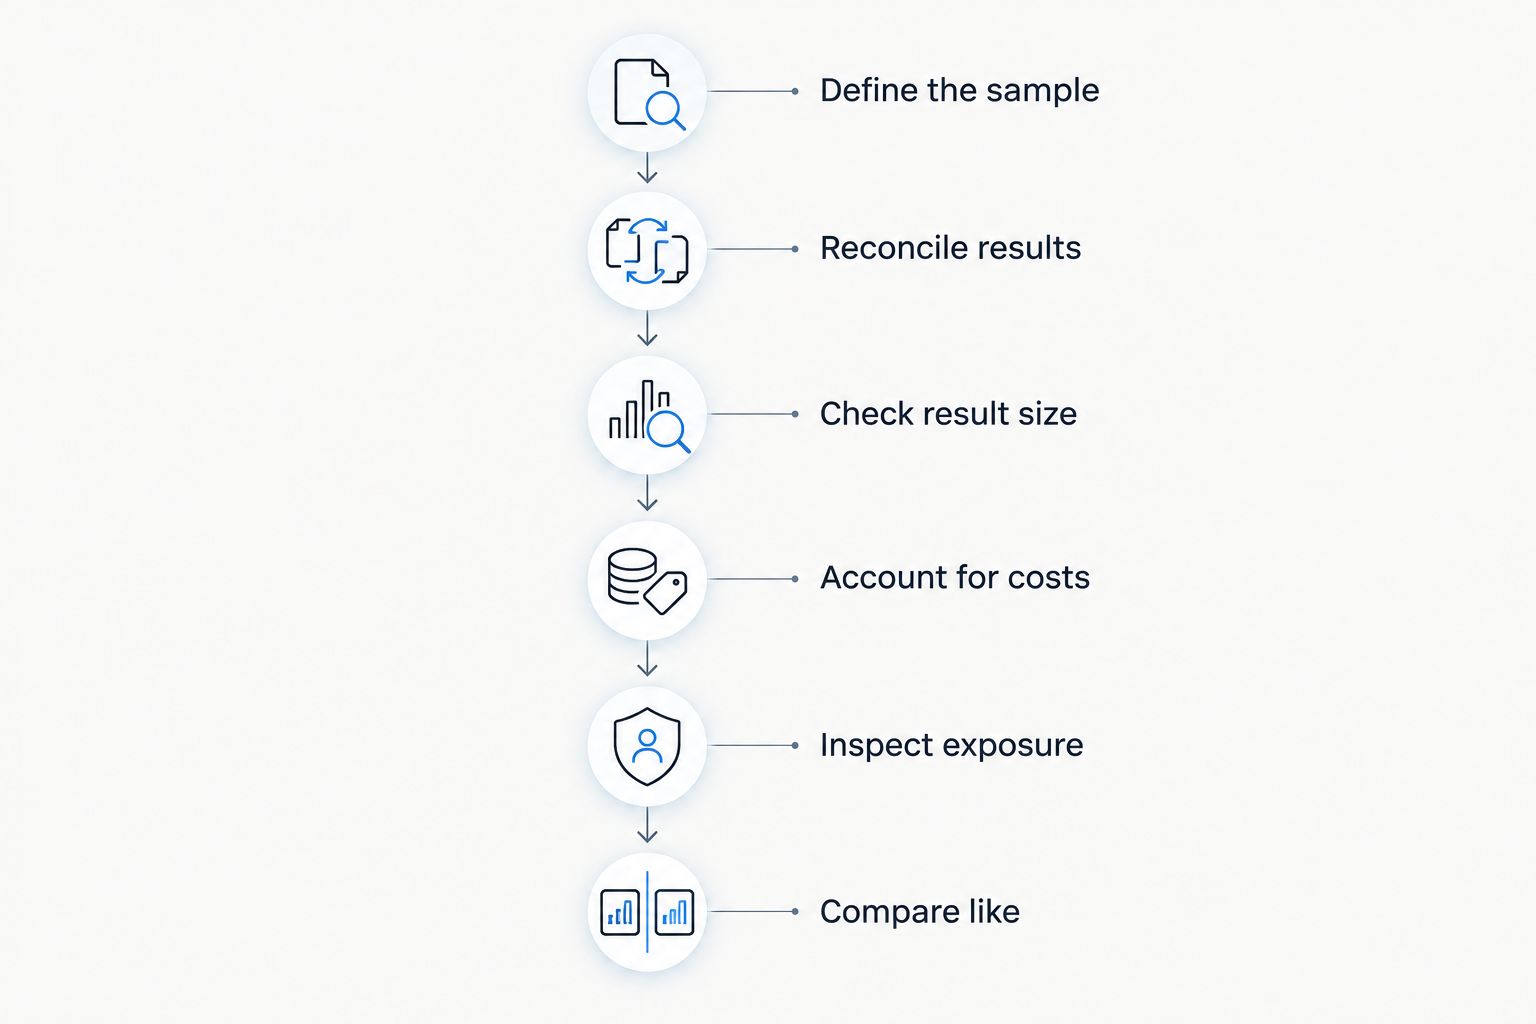
Reconcile the record before interpreting the winning percentage.
Do not treat a small group as a reliable description of future results. Review trading pattern sample size before treating a recent pattern as an established property of your process. Record the number of observations beside each conclusion.
For your 2026 journal, preserve the same definitions across review periods. Changing the counting method halfway through creates a measurement change. It does not establish a performance improvement.
05
What does the winning percentage leave unanswered?
Can I lose money while winning more often than I lose?
Above 50% winning trades, you can still lose money when larger losses and costs exceed winning profits. The percentage establishes which outcome occurred more frequently. It does not establish the net amount earned.
Does a break-even trading result mean my account is unchanged?
A net trading result of 0 in your account currency means the measured trading gains and losses offset. Your account can still differ because of deposits, withdrawals or unrealised positions. Reconcile those items separately.
Is a 50% win rate enough to judge a strategy?
A 50% win rate alone is not enough to judge profitability. Equal-sized gains and losses break even before costs, while unequal result sizes change the outcome. Sample size and execution records remain necessary context.
FAQ
Why am I losing money with a high win rate?
You lose money when total trading losses and costs exceed total gains. A high win rate counts winning trades but does not measure their financial contribution.
What win rate do I need to break even?
A 50% win rate breaks even before costs only when average wins and average losses are equal. Larger average losses or additional costs increase the required winning percentage.
Should I include trading costs in my win rate?
Use net results if you want win rate to reflect profitable trades after costs. State your method clearly because a gross winner can become a net loser after charges.
Do open losses count in my trading win rate?
Open losses do not enter a closed-trade win rate until the relevant trades close. Review unrealised results and account equity separately so closed winners do not conceal current exposure.
Can deposits make my trading performance look stronger?
Deposits increase account funds but are not trading profits. Separate funding movements from trading results when reconciling changes in your account.
Does a VCG Markets performance score prove that my trading is profitable?
A performance score does not prove profitability. Confirm financial performance using net trading results and review the score as separate behavioural information.
Conclusion
For your 2026 trading review, put net results before the winning percentage. Then inspect average result sizes and costs. Keep open exposure visible. These measures answer different questions and belong together.
One last thing
Check whether partial exits are counted as separate wins. Your reported win rate can rise simply because profitable positions were split into more recorded exits. The total financial result stays the same when the underlying executions and costs are unchanged.
Count the wins. Measure their size. Reconcile the net result.
Related guides
This article is for educational purposes only and does not constitute investment advice. Trading CFDs and other leveraged products carries a high level of risk and may not be suitable for all investors.


