Trading performance · Sample quality
There is no universal number of trades that establishes a trading pattern. Your trading sample size must match the question you are testing, the uncertainty you can accept and the independence of the observations. For a 2026 review, a larger trade count does not resolve changing rules, shared exposure or missing records.
Key points
- Trading sample size has no universal minimum. Define the pattern before deciding what evidence would support it.
- Independent trading decisions matter more than the number of order tickets in your trading journal.
- Win rate does not establish profitability. Include gains, losses and recorded trading costs.
- VCG Markets supports performance review through VCG ONE. Behavioural scores do not establish a profitable trading pattern.
01Define the question
02Check sample quality
03Review uncertainty
01
How many trades do you need to assess a trading pattern?
You need enough comparable observations to answer a defined question with stated uncertainty. That is different from reaching a fixed trade count. Start by separating a behavioural pattern from a claim about future returns.
A recorded rule breach establishes that the breach happened. It does not establish how frequently it happens. A winning sequence describes that sequence. It does not establish a stable win probability or show that the gains cover the losses.
For example, reviewing trading rule adherence asks whether your actions matched a written process. Reviewing profitability asks about the distribution of net outcomes. These questions require different records and different interpretations.
- State the pattern you want to investigate.
- Define which trading decisions qualify for the sample.
- Check whether those decisions share the same exposure.
- Choose a measure that answers the question.
- Report the result with its uncertainty and limitations.
Why this matters: a threshold without a question creates false certainty. Counting additional trades cannot repair a review that mixes unrelated setups or excludes inconvenient outcomes. Define what would count as evidence before examining the result.
You can begin documenting behaviour immediately. A conclusion about a repeatable performance pattern needs a separate assessment. Do not treat permission to review your records as permission to increase financial exposure.
02
Define the pattern before counting trades
A pattern needs an observable definition. Write down the entry conditions, exit rules and outcome being assessed. Include the instrument and relevant session information. Avoid definitions that depend on knowing whether the trade eventually won.
A 2026 trading journal should distinguish what you knew before entry from what you learned afterward. Otherwise, a clear-looking historical setup can contain information that was unavailable when the decision occurred. That changes the question being tested.
Choose your measurement unit explicitly. An order ticket, a closed position and a trading decision are not automatically interchangeable. Partial entries and exits can create several records for the same underlying decision.
Use a consistent outcome definition too. If you measure net results, include the costs recorded for those trades. If you measure rule adherence, define what qualifies as adherence before assigning labels. Keep ambiguous records visible rather than forcing them into a convenient category.
- Pattern definition: The conditions that qualify a decision for review.
- Observation unit: The event being counted.
- Outcome measure: The result being assessed.
- Exclusion rule: The documented reason a record does not qualify.
Keep records of strategy changes. A revised exit rule creates a different version of the process. Combining both versions without identifying them makes the total larger while making the conclusion harder to interpret.
03
Match the sample to the question
Different review methods answer different questions. None replaces the others. Choose the method from the claim you want to assess rather than the metric that produces the most encouraging result.
| Review method | Useful for | Limitation |
| Rule-adherence review | Checking decisions against written rules | Does not establish profitability |
| Win-rate review | Estimating the frequency of winning outcomes | Ignores the size of gains and losses |
| Net-outcome review | Examining gains, losses and recorded costs | Depends on outcome variability and sample quality |
Trade count alone also says little about independence. Positions opened around the same market event can share a common driver. Separate ticket numbers do not turn that event into separate independent tests.
Keep the original trade records. Add a grouping field for shared decisions or exposures. This preserves the detail while showing where apparently separate observations depend on the same event.
A large order history is not automatically a large independent sample. When observations are dependent, a calculation that assumes independence can understate uncertainty. Record the dependency before interpreting the confidence of the result.
The practical distinction is between how much activity occurred and how much separate evidence it supplied. Report both where relevant. Neither measure should be silently substituted for the other.
04
Why trading sample size varies
Required sample size depends on what you need to estimate and how precisely you need to estimate it. There is no single threshold that resolves every trading question. The assumptions behind a number matter as much as the number itself.
- Outcome variability. Widely dispersed gains and losses create more uncertainty around an average result.
- Shared exposure. Linked observations contain less independent information than an independence-based calculation assumes.
- Rule consistency. Changing the process changes what the combined sample represents.
- Market conditions. Results from a particular environment do not establish performance in an unobserved environment.
- Record completeness. Missing outcomes can distort the measured pattern when omissions are related to the result.
- Required precision. A narrower statistical margin requires more independent observations under otherwise unchanged assumptions.
A large 2026 trading sample collected within a narrow set of conditions still has narrow coverage. Adding more observations from that same environment improves the description of that environment. It does not automatically establish how the process behaves elsewhere.
Calendar duration and trade count therefore answer different questions. Duration describes the period observed. Count describes the observations recorded. Keep both visible rather than treating either as a substitute for representative evidence.
Splitting records into smaller groups also reduces the evidence available within each group. A time-of-day comparison needs enough relevant observations in each category. A large overall history cannot conceal sparse evidence inside the category being assessed.
05
What does a statistical sample-size calculation tell you?
A standard proportion-estimation calculation illustrates why assumptions must accompany a trade count. For independent win-or-loss observations with an unchanged underlying probability, the conservative normal-approximation calculation uses 385 observations for a 95% confidence level and a margin of about 5 percentage points.
That figure comes from the standard proportion sample-size formula: the squared 95% normal critical value, multiplied by 0.5 and 0.5, then divided by the squared margin of 0.05. Round the required observation count upward. The underlying binomial and normal-approximation methods are described in the NIST/SEMATECH statistical handbook.
This is an estimation example, not a trading threshold. It concerns the precision of a proportion under specified assumptions. It does not establish that a strategy is profitable or that the next trade has the same probability.
The 95% confidence level describes the long-run coverage of the interval procedure under its assumptions. It is not a 95% probability of future trading success. The distinction matters when statistical language appears beside a performance result.
Profitability requires more information than winning frequency. Gains and losses differ in size. Recorded costs affect net outcomes. A proportion-based calculation cannot answer a question about average net returns without addressing those additional quantities.
Do not execute additional trades merely to reach a statistical count. Sample-size planning belongs to the review design. It is not a reason to create market exposure or relax your existing decision rules.
06
How do you assess a pattern without chasing a trade count?
Separate discovery from assessment. Finding an interesting relationship in an existing history creates a hypothesis. Assessing that hypothesis on fresh observations asks whether the relationship persists beyond the records that suggested it.
- Define the pattern. Write a claim that the records can support or contradict.
- Freeze the rules. Preserve the qualifying conditions before assessing fresh observations.
- Record every outcome. Include qualifying losses and document exclusions consistently.
- Review uncertainty. Examine independence, missing data and the precision of the chosen measure.
- Test fresh data. Keep the assessment records separate from the records used to discover the idea.
This sequence keeps the question stable while new evidence arrives. Changing the definition after each result turns an assessment into another search. Preserve the earlier version whenever you revise the process.
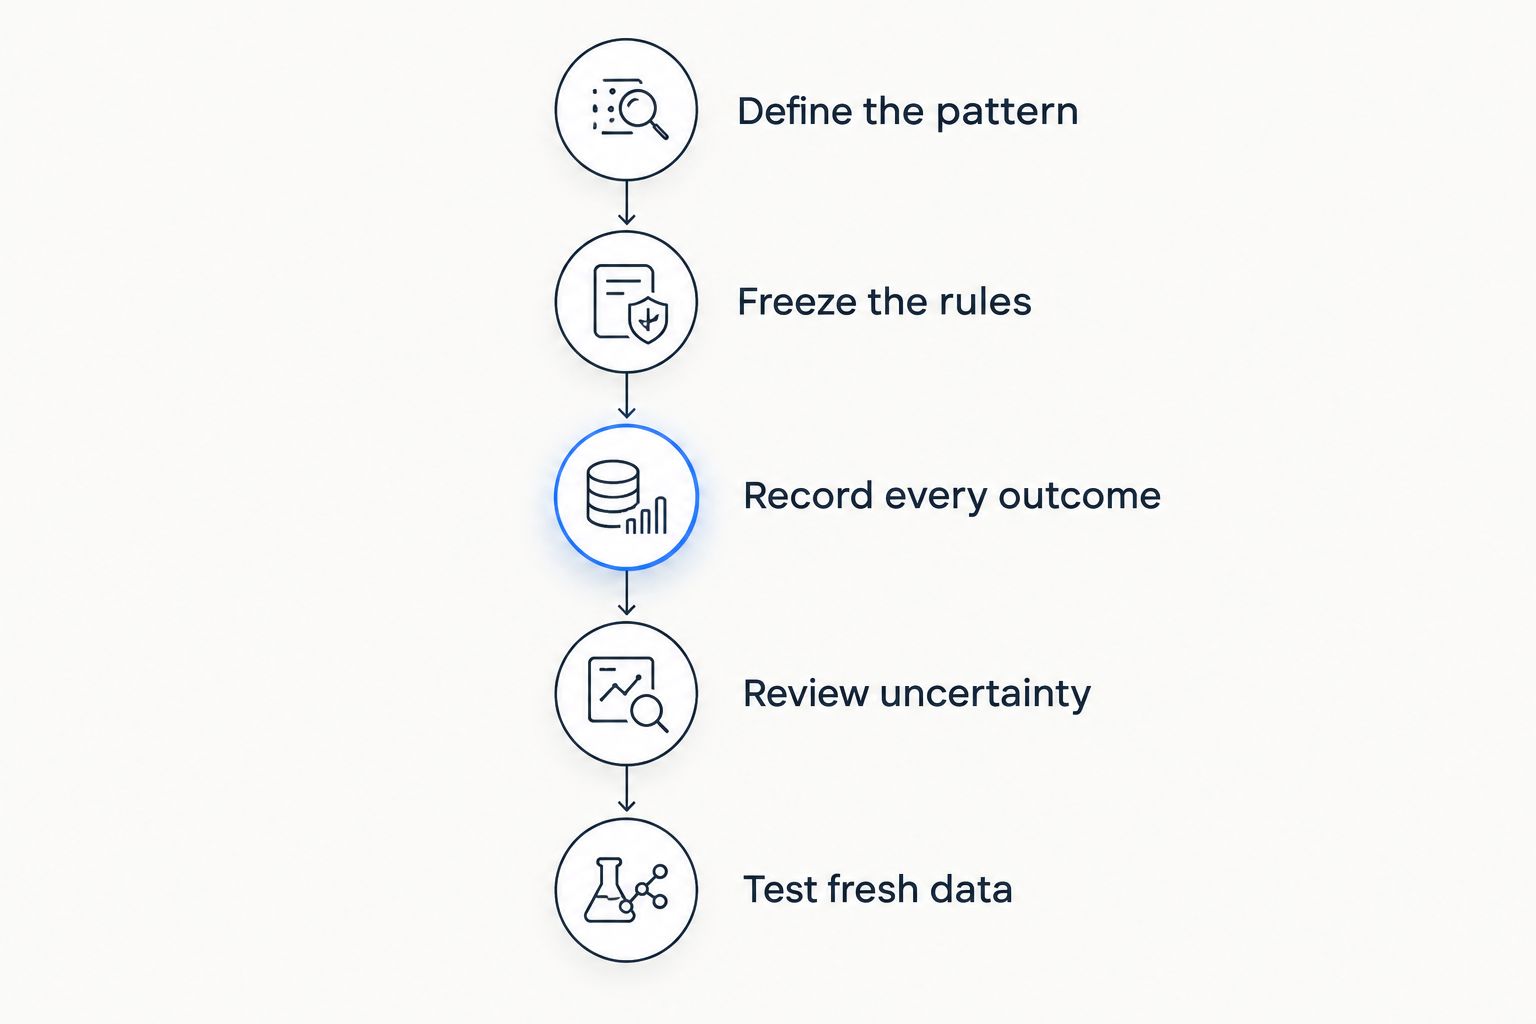
Keep discovery records separate from the fresh observations used to assess the pattern.
Keep the original 2026 review intact when you update it. Record what changed and why. This makes it possible to distinguish evidence that changed from a question that changed.
Include unresolved limitations in the conclusion. State whether shared exposure remains, whether records are incomplete and whether the observed conditions are narrow. A clear limitation is more useful than a confident label unsupported by the sample.
Frequently asked questions
Is there a minimum trading sample size that proves a strategy works?
No universal trading sample size proves that a strategy works. The conclusion depends on the question, independent observations, consistent rules and the uncertainty of the estimated result.
Does the 385-observation example mean I need 385 trades?
385 observations is a standard proportion-estimation example under specified assumptions, not a required trading count. It estimates a win-or-loss proportion with about a 5-percentage-point margin at a 95% confidence level under the stated normal-approximation assumptions.
Do partial exits count as separate observations?
Partial exits are not automatically separate independent observations. They can belong to the same trading decision and share the same underlying exposure.
Can I review my behaviour before I have a large trade history?
You can review documented behaviour without claiming that its frequency is established. A recorded rule breach shows that the breach occurred, not how reliably it predicts future outcomes.
Should I combine trades from different versions of a strategy?
Keep strategy versions identifiable rather than treating changed rules as an unchanged process. A combined total does not establish how either version performed on its own.
Does a high win rate establish profitability?
A high win rate does not establish profitability. The size of gains, the size of losses and recorded trading costs also determine net outcomes.
Should I place more trades to reach a sample-size target?
Do not place trades solely to reach a sample-size target. Collect observations through your defined process rather than creating exposure for the review.
Conclusion
For your 2026 review, write the conclusion before attaching a confidence label. State the pattern assessed, the observation unit and the limitations. Then check whether the records support that exact statement.
One final distinction matters: additional trades cannot undo the fact that a pattern was selected because it looked convincing in the original history. Preserve fresh assessment data. More evidence and reused evidence are not the same thing.
Assess the evidence behind the count, not the count alone.
Related guides
- How correlated pairs create hidden exposure
- Missing data in a trading review
- Hindsight bias in trade reviews
- Putting performance scores in context
This article is for educational purposes only and does not constitute investment advice. Trading CFDs and other leveraged products carries a high level of risk and may not be suitable for all investors.


