Forex education · Technical indicators
An exponential moving average is a practical starting point for trend direction. Relative strength index adds momentum context. Average true range measures volatility. This VCG Markets guide to the best technical indicators for forex trading in 2026 compares six tools by purpose and limitation. None predicts the next price move.
Key takeaways
- The best technical indicators for forex trading answer different questions about trend, momentum and volatility.
- Exponential moving averages provide trend context. Relative strength index measures momentum. Average true range measures volatility.
- VCG Markets recommends defining each indicator’s role before assessing its signals.
- Combine different analytical roles rather than treating similar price calculations as independent evidence.
01Choose a purpose
02Compare six indicators
03Review the evidence
01
Why indicator choice matters
Technical indicators transform historical price data into a different view. They do not create new information about future events. A chart with several indicators can repeat the same evidence in different forms.
Start with the question. Do you need trend direction, momentum context or a measure of recent movement? Choose the calculation that answers that question. Then define what would invalidate your interpretation.
What makes a useful forex indicator?
- Defined purpose: You can explain what the indicator measures.
- Readable calculation: You understand what changes its value.
- Known weakness: You recognise when its signal becomes misleading.
- Distinct contribution: It adds context rather than duplicating another tool.
- Reviewable rules: You can record the same conditions consistently.
The order below starts with a simple trend reference. It then adds separate analytical roles. It is not a ranking of expected returns.
02 · Forex indicators at a glance
| Indicator | Useful for | What it shows | Key limitation |
| Exponential moving average | Trend direction | Recency-weighted average | Lags price changes |
| Relative strength index | Momentum extremes | Relative gains and losses | Extremes can persist |
| Average true range | Volatility measurement | Recent trading ranges | No directional signal |
| Average directional index | Trend strength | Directional movement strength | Does not identify direction alone |
| Bollinger Bands | Relative price position | Price dispersion around an average | Band touches are not reversals |
| Moving average convergence divergence | Momentum transitions | Separation between moving averages | Repeated crosses in sideways markets |
03 · Exponential moving average for trend direction
An exponential moving average gives greater weight to recent prices. Its slope and position relative to price provide a trend reference. Shorter lookbacks respond faster than longer lookbacks.
A 20-period average uses 20 chart periods as its lookback setting. On an hourly chart those periods are hourly bars. The same setting on a daily chart describes a different horizon.
Exponential moving average strengths:
- Provides a clear trend reference.
- Smooths individual price fluctuations.
- Supports consistent rules for price position and slope.
Exponential moving average limitations:
- Responds after prices have changed.
- Produces repeated crossings when price moves sideways.
Suitable for: Traders defining directional context. Verdict: Use as a trend filter, not a standalone entry instruction.
04 · Relative strength index for momentum extremes
The relative strength index compares smoothed gains with smoothed losses. Its scale runs from 0 to 100. The conventional reference levels are 70 for overbought conditions and 30 for oversold conditions.
Those labels describe momentum. They do not mean a currency pair must reverse. A strong trend can keep the reading near an extreme while price continues in the same direction.
Relative strength index strengths:
- Uses a bounded scale.
- Makes momentum extremes visible.
- Allows comparison between price swings and momentum swings.
Relative strength index limitations:
- Extreme readings do not establish reversal timing.
- Divergence can continue without a price reversal.
Suitable for: Traders assessing momentum within an existing price framework. Verdict: Use for context, not an automatic reversal trade.
05 · Average true range for volatility measurement
Average true range measures the size of recent price movement. Its calculation incorporates the current high and low alongside the previous close. It measures movement size rather than direction.
The reading is expressed in price units. Convert it using the instrument’s pip convention before comparing it with a planned distance. Raw readings across different currency pairs are not directly comparable measures of risk.
Average true range strengths:
- Adds volatility context to a chart.
- Distinguishes larger recent ranges from smaller ones.
- Provides a reference for reviewing planned price distances.
Average true range limitations:
- Does not indicate whether to buy or sell.
- Historical ranges do not cap future movement.
Suitable for: Traders examining movement size separately from direction. Verdict: Use for volatility context, not a guaranteed stop distance.
06 · Average directional index for trend strength
The average directional index measures trend strength. A rising reading does not mean price is rising. A sustained downward move can also produce a strong reading.
The wider directional movement system includes positive and negative directional indicators. Keep their directional information separate from the strength reading. Combining these concepts into a single interpretation hides what each calculation measures.
Average directional index strengths:
- Separates trend strength from direction.
- Adds context to trend-following rules.
- Provides a consistent strength measure.
Average directional index limitations:
- Strength readings lag the underlying movement.
- A falling reading does not establish a reversal.
Suitable for: Traders reviewing whether directional movement is strengthening. Verdict: Use as a strength filter alongside price direction.
07 · Bollinger Bands for relative price position
Bollinger Bands place bands around a moving average using standard deviation. A conventional configuration uses a 20-period average with bands 2 standard deviations away. These are reference settings, not an optimised prescription.
The bands widen as measured dispersion increases. They narrow as dispersion decreases. Price touching an outer band does not establish that it is mispriced or about to reverse.
Bollinger Bands strengths:
- Show price position relative to an average.
- Make changing dispersion visible.
- Provide context for reviewing compression and expansion.
Bollinger Bands limitations:
- Narrow bands do not predict breakout direction.
- Price can continue along an outer band.
Suitable for: Traders examining relative price position and changing dispersion. Verdict: Use to describe conditions, not to assume a return to the average.
08 · Moving average convergence divergence for momentum transitions
Moving average convergence divergence compares a faster exponential moving average with a slower one. A signal line smooths that difference. The histogram shows the difference between the main line and signal line.
Conventional settings use 12-period and 26-period averages with a 9-period signal line. Check your platform’s implementation. Do not assume that a signal-line crossover also means the main line has crossed zero.
Moving average convergence divergence strengths:
- Displays changing separation between averages.
- Distinguishes signal-line crosses from zero-line crosses.
- Provides a structured view of momentum transitions.
Moving average convergence divergence limitations:
- Shares underlying information with moving averages.
- Repeated crossovers can occur without a sustained trend.
Suitable for: Traders reviewing changes in trend momentum. Verdict: Use for transitions, not independent confirmation of a moving-average signal.
09 · Build a reviewable indicator process
For a 2026 indicator review, separate selection from execution. An indicator describes a condition. Your trading rules must still define the decision and its limits. Use a pre-trade decision checklist to keep those requirements explicit.
- Define purpose: Write the question each indicator answers.
- Fix settings: Record the currency pair, timeframe and calculation settings.
- Record decisions: Capture the signal and the information available at that moment.
- Review outcomes: Include losing trades, costs and rule deviations.
Change one element at a time when comparing rules. Otherwise you cannot separate the effect of the indicator from changes in timing or execution. Keep the original record rather than replacing it with a cleaner interpretation after the event.
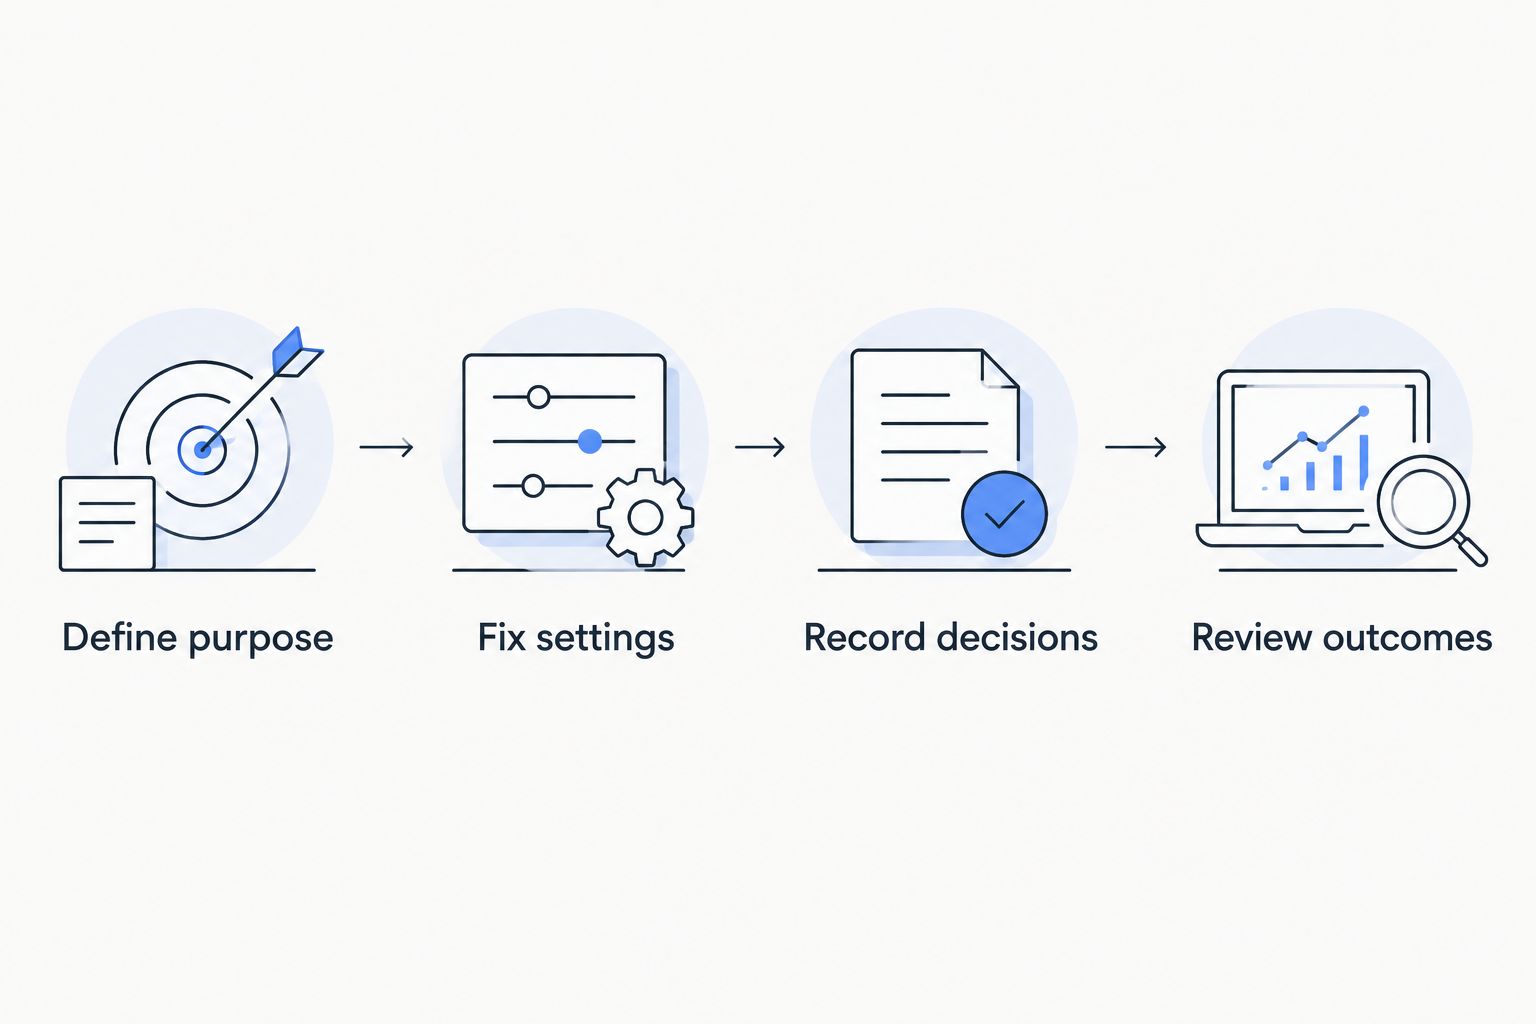
Record the original decision before judging the outcome.
A moving average and moving average convergence divergence share calculations. Their agreement is not independent evidence. Average true range answers a different question, but adding it still does not establish that a strategy has positive expectancy.
FAQ
What are the best technical indicators for forex trading?
The useful choice depends on the question. Exponential moving averages describe trend direction. Relative strength index describes momentum. Average true range measures volatility. None guarantees a profitable signal.
Which forex indicator should I learn first?
An exponential moving average is a practical starting point for understanding trend context. Learn how the lookback changes its response. Then examine its limitations during sideways movement.
Does an overbought reading mean I should sell?
No. An overbought relative strength index reading describes strong recent momentum. It does not establish reversal timing or justify a trade on its own.
Is average true range better than Bollinger Bands?
Neither replaces the other. Average true range measures recent trading ranges. Bollinger Bands show dispersion around an average and price position relative to those bands.
How many forex indicators should I use together?
Use only indicators with clearly defined roles. There is no universal count. Adding similar calculations does not create independent confirmation.
Do the same indicator settings work on every timeframe?
The same settings describe different horizons on different timeframes. A 20-period average on an hourly chart is not equivalent to a 20-period average on a daily chart. Assess each rule on its intended chart.
Can technical indicators predict news-driven currency moves?
Technical indicators do not predict the content of an upcoming announcement. They transform historical market data. New information can change price conditions before a lagging indicator responds.
Conclusion
Start with an exponential moving average if your question is trend direction. Add a momentum or volatility measure only when it answers a separate question. Keep the settings and review criteria explicit.
One last thing: Remove an indicator from your chart and identify which decision changes. If no rule changes, reconsider what that indicator contributes.
Choose a purpose. Understand the limitation. Review the decision.
Related guides
This article is for educational purposes only and does not constitute investment advice. Trading CFDs and other leveraged products carries a high level of risk and may not be suitable for all investors.


