Trading Performance · Trade History
Calculate trading expectancy by dividing the total net result of your closed trades by the number of completed trades. The equivalent formula is win rate multiplied by average win, minus loss rate multiplied by average loss. Include trading costs without counting them twice. The result describes your recorded sample, not what your next trade will earn.
Key takeaways
- How to calculate trading expectancy: divide total net results by completed trades.
- Include commissions and financing. Do not subtract spreads again when execution prices already reflect them.
- Use realised results, not planned targets. Keep open positions outside the closed-trade calculation.
- VCG Markets traders should read expectancy alongside drawdown and sample quality, not as a trading forecast.
01Calculate the average
02Check the records
03Interpret the result
01
How do you calculate trading expectancy from your trade history?
Trading expectancy = total net result ÷ completed trades. Use one consistent account currency. If your 2026 trade history contains deposits or withdrawals, exclude those account movements from trading results.
You can express expectancy in money or initial-risk units. For the second approach, first establish how you record trade R-multiples. Money measures the account result per trade. Risk units measure results relative to the amount initially risked.
- Define the sample. Choose a date range and a consistent definition of a completed trade.
- Reconstruct each result. Combine the relevant executions and attributable costs.
- Add the net results. Keep losses negative and wins positive.
- Count completed trades. Include trades with a net result of zero.
- Divide the total by the count. Label the result with its unit and sample period.
The weighted version separates frequency from size:
Expectancy = (winning trades ÷ all trades × average net win) − (losing trades ÷ all trades × average net loss magnitude).
Average loss magnitude is positive in this formula. Subtract it once. Classify wins and losses after costs so a gross gain that becomes a net loss enters the correct group.
Both formulas give the same result when they use the same completed trades and net outcomes. If they disagree, check the denominator, breakeven trades and loss signs before interpreting performance.
02
Why this matters: win rate leaves out loss size
Win rate measures how often completed trades finish positive. It does not measure how much winning trades earn or losing trades lose. Expectancy combines those dimensions in a single average.
A sample can contain more winners than losers and still have negative expectancy. The losing trades need only outweigh the winning trades in total money terms. The reverse is also mathematically possible.
Positive expectancy means your selected closed trades produced a positive average net result. It does not establish that the same average will persist. Negative expectancy means that sample lost money per completed trade on average.
Zero currency units per trade means the sample finished at net breakeven. It does not mean the account avoided losses along the way. The sequence of results disappears inside the average.
Keep the distinction visible in your 2026 review: expectancy describes the average outcome, while drawdown describes declines from an equity peak. Neither replaces the other. A positive average can coexist with a substantial decline during the sample.
03
Prepare the trade history before calculating
An execution record is not automatically a completed trade. Partial entries and exits can create several rows for the same position. Decide how those rows belong together before counting outcomes.
For a position-based review, combine the associated entries and exits into one completed trade. Sum their realised results and attributable costs. Apply the same treatment to profitable and losing positions.
- Trade boundary: identify what starts and completes each trade.
- Net result: include commissions, financing and other attributable trading charges.
- Currency: use the account statement’s conversion basis consistently.
- Initial risk: retain the amount recorded when the position was opened.
- Review tags: preserve the setup, instrument and relevant timing information.
Spreads and slippage affect executed entry and exit prices. If your realised result already uses those prices, subtracting estimated spread or slippage again double-counts their effect. Check how your statement presents charges before adjusting the result.
Keep open positions outside a closed-trade calculation. Their current gains and losses still matter to account equity, but they are not final outcomes. Record that exclusion beside the result.
Save the original 2026 export separately from your review sheet. This preserves a reference for checking missing rows, duplicate entries and later corrections.
04
Money expectancy and risk-unit expectancy
Money expectancy is the average net account-currency result per completed trade. Risk-unit expectancy is the average of each trade’s net result divided by its own initial risk. They answer different questions.
| Measure | Use for | Limitation |
| Money expectancy | Measuring the realised account result per trade. | Larger positions contribute larger money outcomes. |
| Risk-unit expectancy | Comparing outcomes relative to recorded initial risk. | Requires a valid initial-risk record for every included trade. |
One risk unit, written as 1R, equals the amount initially risked on that trade. Divide each net result by its own initial risk first. Then average those individual results.
Dividing total profit by total initial risk produces a risk-weighted aggregate. It is not generally the same as the simple average of individual trade R-multiples when risk amounts differ. Label these calculations separately.
Do not replace initial risk with the eventual loss or a later stop distance. That changes the measurement basis after the outcome. If initial risk was not recorded reliably, retain money expectancy rather than manufacturing precision.
05
Why trading expectancy varies
Expectancy changes when the included outcomes change. Before attributing a change to trading skill, check whether the sample or its measurement basis changed.
- Win frequency: the share of completed trades finishing positive affects the weighted result.
- Outcome size: average wins and average losses determine how much each side contributes.
- Trading costs: commissions and financing change the net result even when gross outcomes match.
- Position sizing: changing size alters money expectancy without necessarily changing risk-unit expectancy.
- Sample composition: mixing setups, instruments or holding periods changes the group being measured.
- Unusual outcomes: a large gain or loss can account for a substantial part of the sample average.
Calculate the full-sample result before separating trades into groups. Then compare clearly defined groups without quietly dropping inconvenient outcomes. Keep each group’s trade count beside its expectancy.
A positive 2026 sample does not establish a permanent edge. Read the guidance on trading pattern sample size before treating a small group as a repeatable pattern. Trades sharing the same market exposure also need context; separate rows do not necessarily represent independent observations.
Inspect the largest outcomes without deleting genuine trades. A sensitivity check can show how dependent the average is on an unusual result. Keep the original expectancy visible alongside that check.
06
Build a repeatable review
Use a spreadsheet with one numeric net outcome per completed trade. Calculate the average of that column. Independently divide its sum by its numeric trade count to verify the result.
Blank cells are not zero-result trades. Spreadsheet averages generally ignore blanks but include numeric zeros. Check missing outcomes before trusting the denominator.
- Reconcile results. Match the included net outcomes to the relevant statement total.
- Check the count. Count completed trades rather than executions or spreadsheet rows.
- Confirm the unit. Keep account currency and risk units in separate columns.
- Record the scope. Save the dates, exclusions and trade-definition rule.
- Review context. Read expectancy alongside drawdown and the distribution of results.
Save the calculation method with your 2026 journal. A later comparison only answers a useful question when the definitions remain consistent. If you change how partial exits are grouped, recalculate the comparison period on the same basis.
Separate observation from explanation. An expectancy decline identifies a change in recorded outcomes. It does not identify the cause by itself. Use the underlying trades to investigate costs, sizing, execution and rule adherence.
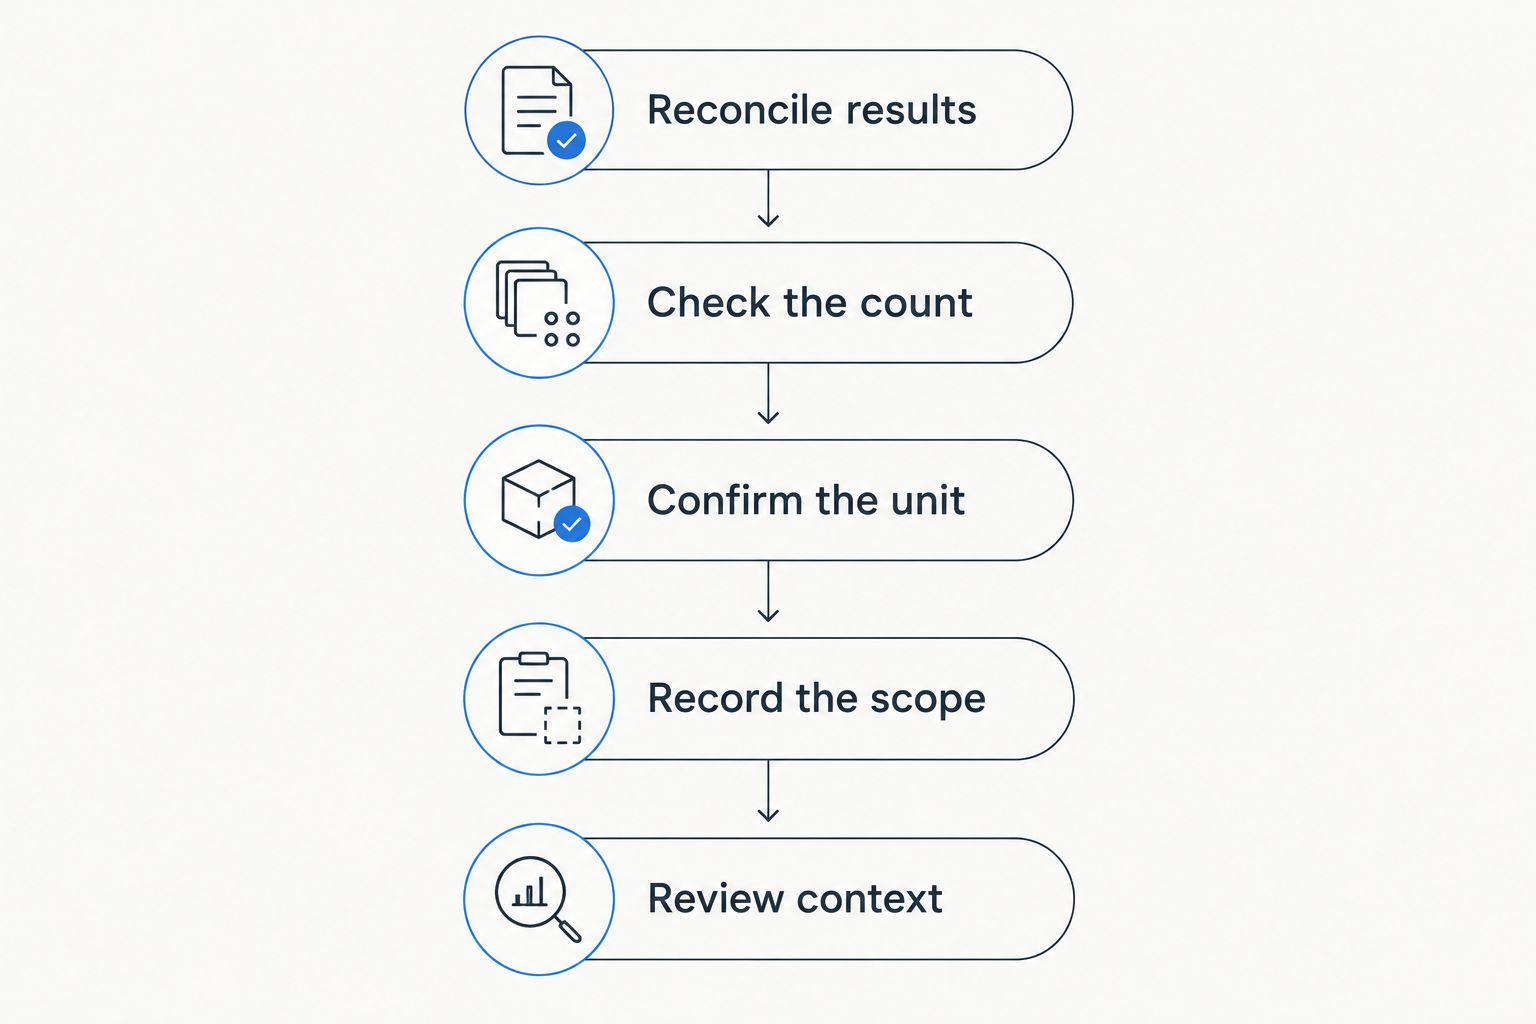
Consistent definitions make expectancy comparisons meaningful.
FAQ
How do I calculate trading expectancy from my trade history?
Divide the total net result of your completed trades by the number of completed trades. Use one consistent currency and include attributable trading costs without double-counting them.
Can I have positive expectancy with a low win rate?
Yes. Positive expectancy occurs when total net gains exceed total net losses across the sample, regardless of whether winning trades outnumber losing trades.
Should I include breakeven trades in expectancy?
Yes. Include trades with a net result of zero in the total trade count. A trade that breaks even before costs belongs in the losing group if its final net result is negative.
Do I include open positions when calculating expectancy?
No. A closed-trade expectancy calculation includes completed outcomes only. Review open-position gains and losses separately because they still affect account equity.
How many trades do I need before expectancy is reliable?
There is no universal trade count that makes expectancy reliable. Confidence depends on outcome variability, sample selection and how representative the trades are of the process being reviewed.
Is expectancy in money the same as expectancy in R?
No. Money expectancy averages net currency results. Expectancy in R averages each trade’s net result relative to its own recorded initial risk.
Does positive trading expectancy mean I should increase position size?
No. Positive historical expectancy alone does not justify increasing position size. It does not establish future performance or describe the full risk of the trading process.
Conclusion
Calculate the net average first. Then check what sits inside it: trade boundaries, costs, position sizes and unusual outcomes. Keep the sample dates and count attached whenever you record or share the result.
One final check: changing how partial exits are grouped can change expectancy per trade without changing total profit. That is a denominator change, not a change in account performance. A consistent trade definition protects the comparison.
Expectancy describes the recorded average. It does not promise the next outcome.
Related guides
- Weekly trading review workflow
- How to measure maximum drawdown
- Execution errors and strategy results
This article is for educational purposes only and does not constitute investment advice. Trading CFDs and other leveraged products carries a high level of risk and may not be suitable for all investors.


