Market Education · Precious Metals
Read the gold-silver ratio by dividing the gold price by the silver price using matching currencies and weight units. A rising ratio means gold is outperforming silver. A falling ratio means silver is outperforming gold. In 2026, as at any other time, neither direction tells you what to buy or when a reversal will happen.
TL;DR
- How to read gold silver ratio: divide matching gold and silver quotes to measure relative performance, not predict returns.
- Gold outperforms silver when the ratio rises, even when both metals fall.
- A high gold-silver ratio does not establish that silver is undervalued or due to rise.
- Check both underlying charts, quote timing and instrument terms before interpreting the ratio.
01Read the relationship
02Check both metals
03Separate context from signals
01
How do you read the gold-silver ratio without treating it as a signal?
Gold-silver ratio = gold price ÷ silver price. Both prices must use the same currency and weight unit. The result expresses gold's quoted value in equivalent units of silver. It is a relationship between prices, not a forecast for either metal.
Read the numerator and denominator separately. Gold sits on top of the calculation. Silver sits underneath. A change in either affects the result, so the ratio alone cannot tell you which metal moved or why.
Why this matters
Relative strength and positive returns are different things. Gold can outperform silver while losing value. Silver can outperform gold while also losing value. Calling either metal stronger describes the comparison, not the return you would receive from holding it.
If you are reviewing gold's own chart, the guide to indicators for gold trading provides a separate starting point. Keep that analysis distinct from the ratio calculation. The ratio describes the relationship; the underlying chart shows the individual market.
For a 2026 chart review, label your observation precisely: gold outperformed silver over the selected period. Do not silently change that statement into gold will rise next.
02
What rising and falling ratios actually tell you
A rising ratio means gold's percentage performance exceeded silver's over the same interval. A falling ratio means the reverse. Neither observation requires the stronger metal to have risen in absolute terms.
| Ratio movement | What it establishes | What it does not establish |
| Rising | Gold outperformed silver. | Gold rose or silver will rebound. |
| Falling | Silver outperformed gold. | Silver rose or gold will rebound. |
| Unchanged | Both had equal percentage performance. | Both underlying prices were unchanged. |
When both metals rise, the ratio rises if gold gains more in percentage terms. When both fall, the ratio rises if silver loses more. Those are different market experiences with the same ratio direction.
An unchanged ratio deserves the same care. Both metals can move substantially while their relationship stays stable. The comparison is useful because it compresses the relationship into a single series. Its limitation is that the compression hides each metal's absolute movement.
03
Why the gold-silver ratio varies
The calculation changes when the relationship between its inputs changes. Before attaching an economic explanation, establish what happened inside the calculation.
- Gold movement. With silver unchanged, a gold increase raises the ratio. A gold decrease lowers it.
- Silver movement. With gold unchanged, a silver increase lowers the ratio. A silver decrease raises it.
- Joint movement. When both move, their relative percentage changes determine the direction.
- Quote timing. Prices captured at different moments do not describe the same market snapshot.
- Instrument selection. Mixing spot quotes with futures quotes introduces differences beyond the metal comparison.
These factors explain the arithmetic or the construction of the series. They do not prove why traders changed their valuations. A chart alone cannot establish a causal explanation for the move.
Separate the observation from the explanation in your notes. The ratio rose is observable. A claim about the reason needs separate evidence. That distinction matters when a convincing market narrative arrives after the price movement.
04
A chart-reading process for 2026
Use the ratio as a description you can check. Work through the inputs before deciding what the chart means.
- Match inputs. Use the same currency, weight unit and instrument basis. Check that both quotes refer to the same observation time.
- Set the period. Choose the interval your observation describes. Keep that interval consistent across the ratio and underlying charts.
- Read direction. Establish whether the ratio rose, fell or stayed unchanged over that interval.
- Inspect both metals. Check whether each metal rose or fell. Identify which changed more in percentage terms.
- Write the limit. Record what the observation does not establish. Include the absence of a forecast or entry instruction.
Your finished note should describe the comparison without prescribing an action. For example, explain whether outperformance came from a stronger rise or a smaller fall. Those descriptions preserve information that a ratio chart alone leaves out.
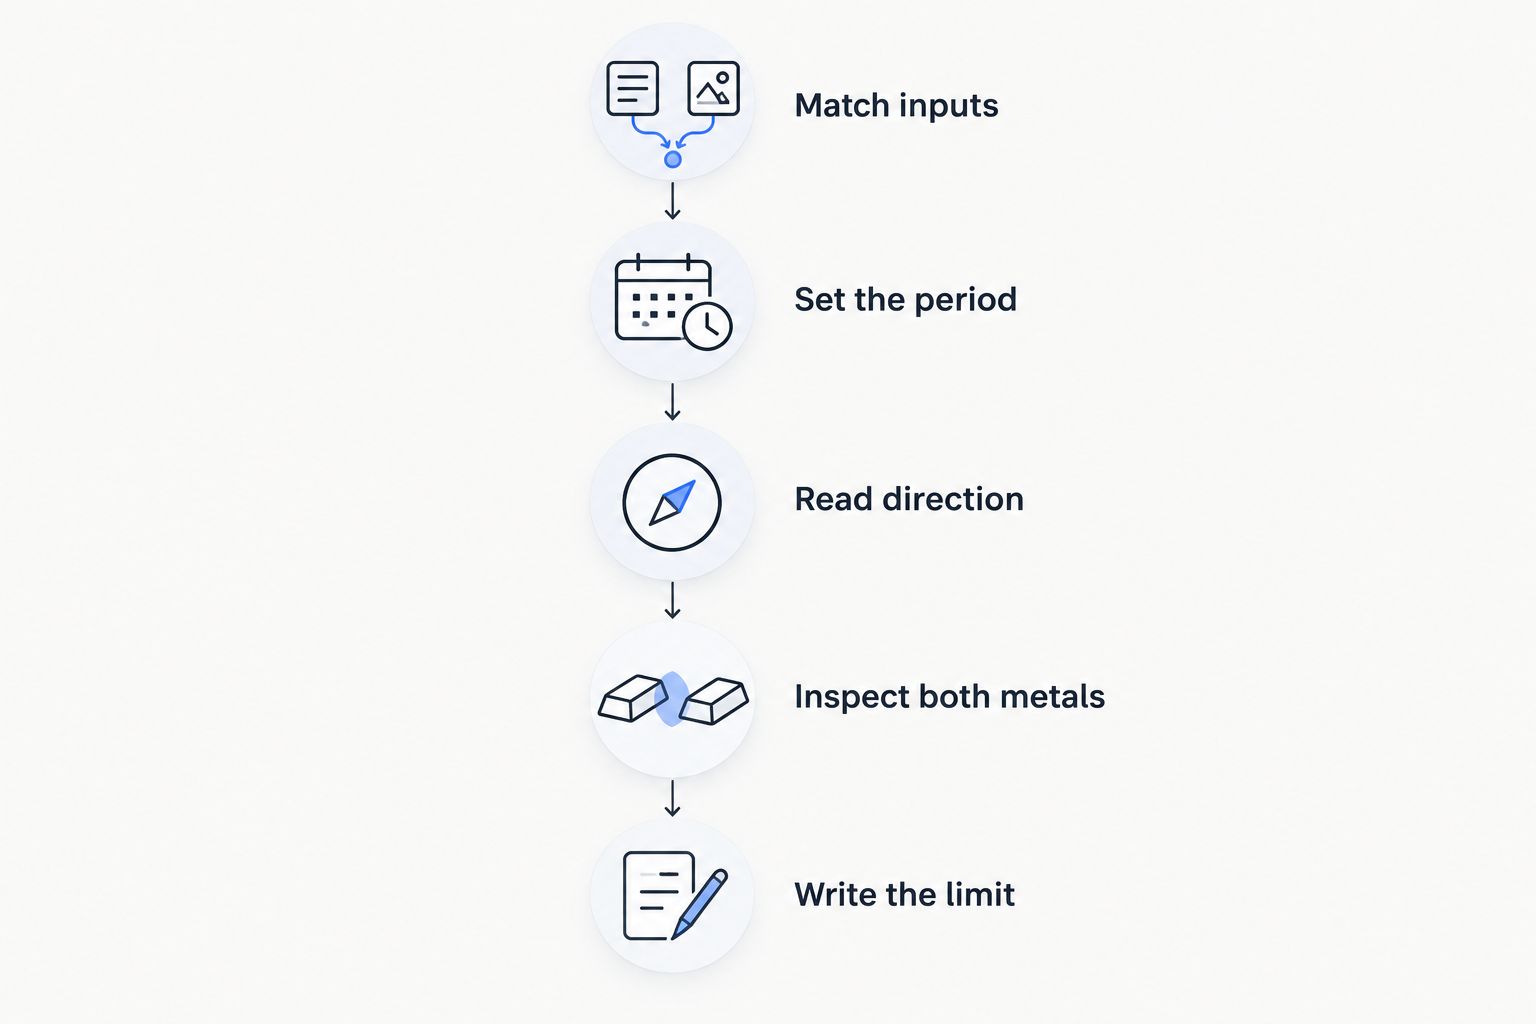
Inspect both metals before turning a ratio movement into a market explanation.
Changing the chart window can change the story you see. A ratio can rise within a shorter interval while remaining below its level at the start of a longer interval. Neither observation cancels the other. Each answers a different time-based question.
Keep the timeframe attached to your conclusion. Without it, stronger and weaker are incomplete descriptions. Avoid choosing a new window simply because it supports the explanation you already prefer.
05
Why a high ratio is not a silver buy signal
High is a comparison with a chosen reference. It is not a valuation conclusion. A ratio above its historical average establishes a position relative to that average, not an obligation to return to it.
The reference period matters. Different start dates and end dates produce different averages. A statement about an extreme needs to name the dataset and period used to define it.
Even a falling ratio would not prove that silver rose. Gold could fall faster than silver. Treating the expected direction of the ratio as the expected direction of silver skips a necessary step.
For any 2026 analysis, distinguish a historical description from a tested forecasting rule. A forecasting claim needs a defined method, an evaluation period and evidence about failures as well as successes. A memorable chart level supplies none of those by itself.
Relative does not mean mispriced. Silver being less expensive relative to gold does not establish that either metal is incorrectly valued.
06
A ratio chart is not a position-size calculation
The gold-silver ratio compares quoted values. It does not calculate an appropriate position size, maximum loss or account exposure. Those require information about the actual instruments and positions.
Equal quantities of gold and silver do not create equal financial exposure. Matching quantities, matching monetary values and matching sensitivity to price changes are different tasks. The ratio cannot substitute for the contract specifications behind them.
Taking opposing positions also does not remove risk. Each position can move against its entry. The combined result depends on position sizes, execution and instrument terms, not just whether the ratio eventually reaches a chosen level.
Keep three questions separate: what happened to the relationship, what happened to each metal and what a particular position would have experienced. The ratio directly answers only the first. Reconstructing the others requires their own data.
Does a falling gold-silver ratio mean silver is rising?
A falling gold-silver ratio means silver is outperforming gold, not necessarily rising. Both metals can fall while gold falls faster in percentage terms. Check silver's own chart before describing its direction.
Can the ratio tell me whether gold is expensive?
The gold-silver ratio tells you how gold is valued relative to silver in the selected quotes. It does not establish whether gold is expensive in an absolute sense. That conclusion requires a separate valuation framework and evidence beyond the ratio.
FAQ
How do I calculate the gold-silver ratio?
Divide the gold price by the silver price using the same currency and weight unit. Use matching observation times and comparable instruments so the inputs describe the same relationship.
What does a rising gold-silver ratio mean?
A rising gold-silver ratio means gold outperformed silver over the selected period. Gold can outperform by rising more or by falling less.
Does a low gold-silver ratio mean gold will rise?
A low gold-silver ratio does not predict that gold will rise. It describes gold's value relative to silver against whatever reference you selected.
Is a high gold-silver ratio a reason to buy silver?
A high gold-silver ratio is not a standalone reason to buy silver. It does not establish silver's future direction or when the relationship will change.
Can both metals fall while the gold-silver ratio rises?
Both metals can fall while the gold-silver ratio rises. This happens when silver falls more than gold in percentage terms over the same interval.
Should I mix spot and futures prices when calculating the ratio?
Use comparable instruments when calculating the ratio. Mixing spot and futures quotes introduces differences in instrument basis rather than isolating the relationship between the metals.
Is the gold-silver ratio still useful in 2026?
The gold-silver ratio remains a mathematical comparison of gold and silver quotes in 2026. Its use is describing relative value and performance, not supplying a standalone forecast.
One last thing
Before closing a ratio chart, write down whether each metal rose or fell over your selected period. Then describe their relative performance separately. If you cannot complete both statements, the ratio has not yet given you a complete account of what happened.
The useful surprise is that a correct ratio observation can still support an incorrect market conclusion. The arithmetic can be right while the interpretation goes too far.
Read the relationship. Check both metals. Leave the forecast unclaimed.
Related guides
This article is for educational purposes only and does not constitute investment advice. Trading CFDs and other leveraged products carries a high level of risk and may not be suitable for all investors.


