Performance Review
Read profit factor as total winning-trade profits divided by the absolute total of losing-trade losses. A result above 1 means recorded profits exceed recorded losses. It does not show drawdown, open-position risk or whether trading costs are fully included.
Key takeaways
- How to read profit factor: compare recorded profits with recorded losses, then examine risk separately.
- A profit factor above 1 does not establish acceptable drawdown or future profitability.
- VCG Markets supports behavioural performance review through VCG ONE. A performance score does not replace risk assessment.
A profitable closed-trade record can sit beside a large unrealised loss. Start with the distinction between [trading balance and equity](https://vcgmarkets.com/en/blog/trading-balance-equity) before treating a profit factor as evidence of account health.
01Read the calculation
02Inspect the risk
03Review consistently
01
How to read profit factor without ignoring trading risk
Profit factor = gross profit ÷ absolute gross loss. Gross profit is the sum of winning-trade profits. Gross loss is the sum of losing-trade losses, expressed as a positive amount for this calculation.
Read the ratio against 1, not against another trader’s headline result. The calculation compares money won with money lost. It does not measure the percentage of trades that win.
| Profit factor | What it establishes | What to check |
| Below 1 | Recorded losses exceed recorded profits. | Loss size, costs and rule adherence. |
| Equal to 1 | Recorded profits equal recorded losses. | Any costs excluded from the calculation. |
| Above 1 | Recorded profits exceed recorded losses. | Drawdown, concentration and open losses. |
Profit factor has no currency unit. Use profit and loss amounts expressed in the same account currency. If gross loss is zero, ordinary division cannot produce a finite ratio. An infinite or unavailable display is not evidence of unlimited profitability.
02
Why this matters: profit factor does not show the path
Rearranging the same closed-trade results leaves profit factor unchanged. It changes when losses arrive. A concentrated losing sequence can create a very different account experience from losses spread between winners.
That is why profit factor belongs beside [maximum drawdown](https://vcgmarkets.com/en/blog/measure-maximum-drawdown). Drawdown measures a decline from a prior peak. Profit factor compares aggregate gains and losses without preserving their sequence.
Also distinguish balance-based drawdown from equity-based drawdown. Closed results can conceal adverse movement inside open positions. Equity includes unrealised profit and loss, so its path answers a different question.
A profit factor above 1 is a result to investigate, not permission to increase exposure. Review how much capital was at risk to produce it. A ratio alone does not establish whether that risk fitted your limits.
03
Why profit factor varies
A change in profit factor does not explain its own cause. Separate changes in trading behaviour from changes in the calculation before judging the result.
- Cost treatment. Commissions and financing charges affect net results. Establish whether they are included, excluded or recorded separately. Spread effects already embedded in execution prices should not be deducted again.
- Sample selection. Changing the date range changes the included trades. A period dominated by favourable conditions does not establish performance in other conditions.
- Position sizing. Money-based profit factor gives larger positions more influence. A strong result from a large winner does not prove consistent execution across smaller trades.
- Winner concentration. A small group of winning trades can account for much of gross profit. Inspect that dependence without deleting legitimate results from the official record.
- Trade grouping. Partial exits grouped as a complete position can produce a different ratio from exits treated separately. Document the reporting convention before comparing records.
Keep these definitions beside the calculation. Otherwise, a change in reporting can look like a change in trading performance.
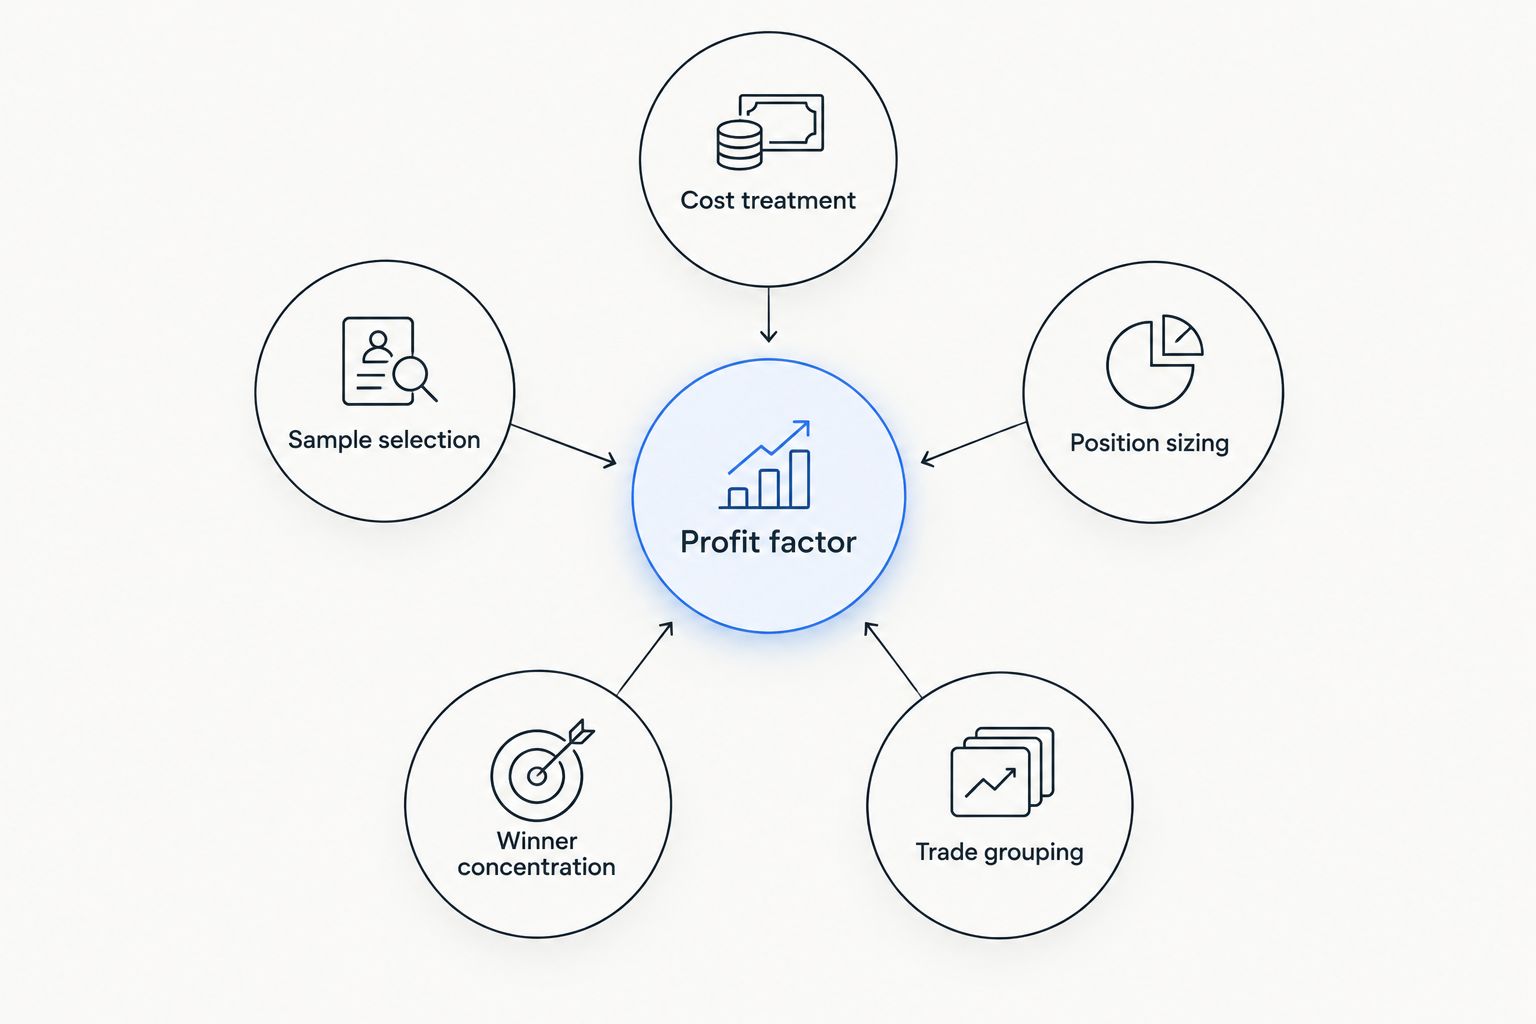
Check the calculation and the trade record before interpreting a change in profit factor.
Winner concentration deserves particular attention. Recalculate without the largest winner as a sensitivity check. Keep both results clearly labelled. This shows dependence on that trade; it does not justify erasing it.
04
How do you review profit factor alongside risk?
Use a repeatable review sequence. Start with record integrity. Interpretation comes after you know which trades and charges the calculation contains.
- Fix the scope. Record the account, date range and included instruments. Separate live results from simulated results. Keep deposits and withdrawals outside trading profit and loss.
- Reconcile the totals. Match the winning and losing amounts to the underlying records. Resolve missing trades, duplicate entries and separately booked charges before calculating the ratio.
- Read the equity path. Review peak-to-trough declines and open losses. Check whether the closed-trade result leaves out risk still held in the account.
- Inspect the distribution. Review the largest winner, largest loss and losing sequences. Compare position sizes. An aggregate ratio cannot explain these differences.
- Check repeatability. Compare consistently defined periods and setup groups. Record whether the same rules were followed rather than judging decisions solely by whether they made money.
There is a trade-off in splitting the record. Smaller groups make differences easier to see. They also contain less evidence. Keep the full-account result visible beside any breakdown.
Repeatedly searching for a date range with a favourable ratio selects the answer after seeing the results. Define your review window in advance. Preserve unfavourable periods rather than moving the start date past them.
05
Is profit factor above 1 enough to judge a strategy?
Above 1 means recorded profits exceed recorded losses. It does not establish an acceptable strategy. You still need the cost basis, drawdown, sample composition and exposure history.
A profitable trade can break a trading rule. A losing trade can follow it. Keep outcome measures separate from process measures so a favourable result does not hide a decision you intended to avoid.
Does a profit factor of 1 mean I broke even?
A profit factor of 1 means the included profits and losses balance. It establishes trading break-even only if the calculation captures all relevant trading costs. It says nothing about unrealised positions outside the calculation.
What does a profit factor of 0 mean?
A profit factor of 0 means recorded gross profit is zero while recorded gross loss is positive. If both totals are zero, the ratio is undefined. A zero display therefore needs checking against the underlying record.
FAQ
What is profit factor in trading?
Profit factor is total winning-trade profit divided by the absolute total of losing-trade losses. Check the report’s cost treatment before interpreting it as a net-performance measure.
Is a higher profit factor always better?
A higher profit factor shows more recorded profit relative to recorded loss. It does not establish lower drawdown, smaller exposure or more dependable future results.
Can profit factor be positive while my account is losing money?
Yes. A profit factor between 0 and 1 is positive but means recorded losses exceed recorded profits. Even a ratio above 1 can exclude open losses or separately recorded costs.
Does profit factor include open trades?
A closed-trade profit factor excludes unrealised gains and losses on open positions. Read the report definition and check account equity separately.
How many trades do I need before trusting profit factor?
No universal trade count makes profit factor dependable. Review the range of market conditions, dependence between trades and concentration of profits alongside the sample size.
Is profit factor the same as win rate?
No. Profit factor compares profit and loss amounts. Win rate measures the share of trades that win, so it does not capture the size of those wins and losses.
Conclusion
Before your next review, write a short definition beside the ratio: period, included trades, cost treatment and grouping method. Then read it beside the equity curve. That keeps a familiar number from becoming a substitute for the underlying evidence.
Profit factor summarises recorded outcomes. It does not summarise trading risk.
Related guides
This article is for educational purposes only and does not constitute investment advice. Trading CFDs and other leveraged products carries a high level of risk and may not be suitable for all investors.


