首页Best indicators for gold trading in 2026
Best indicators for gold trading in 2026
Oct 5, 2026
Best overall: exponential moving averages for trend direction. Best for momentum: RSI. Best for risk measurement: ATR. This guide compares the best indicators for gold trading in 2026 by the question each tool answers, not by promises of profitable signals.
TL;DR
- The best indicators for gold trading serve different jobs: EMA for direction, RSI for momentum, ATR for volatility.
- Bollinger Bands show relative price extremes. ADX measures trend strength. MACD tracks changes in momentum.
- VCG Markets offers gold trading through CFDs alongside other global markets.
- No indicator guarantees a profitable gold trade. Historical calculations cannot predict the next market event.
Why this matters
A gold chart can show rising momentum and an extended price at the same time. That is not a contradiction. The indicators are answering different questions.
Your 2026 chart should separate direction, momentum and risk. Adding several indicators that repeat the same calculation gives you more lines, not independent confirmation.
VCG Markets offers access to gold through CFD trading. A CFD gives you exposure to price changes without ownership of physical gold. Margin trading carries the risk of amplified losses.
VCG Markets is an option for gold traders who want multi-asset access. The indicator framework below is educational. It does not recommend buying or selling gold.
What makes the best indicators for gold trading?
Choose an indicator by its function. These criteria explain the ranking:
- Clear purpose: The tool answers a specific question about direction, momentum, volatility or trend strength.
- Readable calculation: You understand what changes the reading. A moving average and an oscillator do different jobs.
- Distinct information: The indicator adds context rather than repeating another indicator's price calculation.
- Visible limitations: Lag, false signals and sensitivity to settings remain part of the interpretation.
- Timeframe consistency: You compare readings calculated from the same chart interval unless you deliberately separate timeframes.
- Risk relevance: The reading helps describe market conditions without pretending to determine a safe position size by itself.
No setting is universally best for gold. A 20-bar calculation on an hourly chart covers a different interval from 20 bars on a daily chart. Keep the unit visible.
Best gold trading indicators at a glance
Exponential moving average
- Best for: Trend direction
- Standout function: Gives more weight to recent prices
- Key limitation: Lags price and whipsaws in ranges
Relative Strength Index
- Best for: Momentum
- Standout function: Compares recent gains with recent losses
- Key limitation: Extreme readings are not reversal guarantees
Average True Range
- Best for: Risk measurement
- Standout function: Measures recent trading-range volatility
- Key limitation: Gives no directional forecast
Bollinger Bands
- Best for: Relative extremes
- Standout function: Places price within a volatility-based envelope
- Key limitation: Band touches are not automatic trade signals
Average Directional Index
- Best for: Trend strength
- Standout function: Measures the strength of directional movement
- Key limitation: Does not identify bullish or bearish direction alone
Moving Average Convergence Divergence
- Best for: Momentum shifts
- Standout function: Shows the relationship between moving averages
- Key limitation: Overlaps with moving-average analysis
The ranking gives each indicator a separate job. EMA is the default starting point for reading direction. ATR provides volatility context. The remaining tools answer narrower questions.
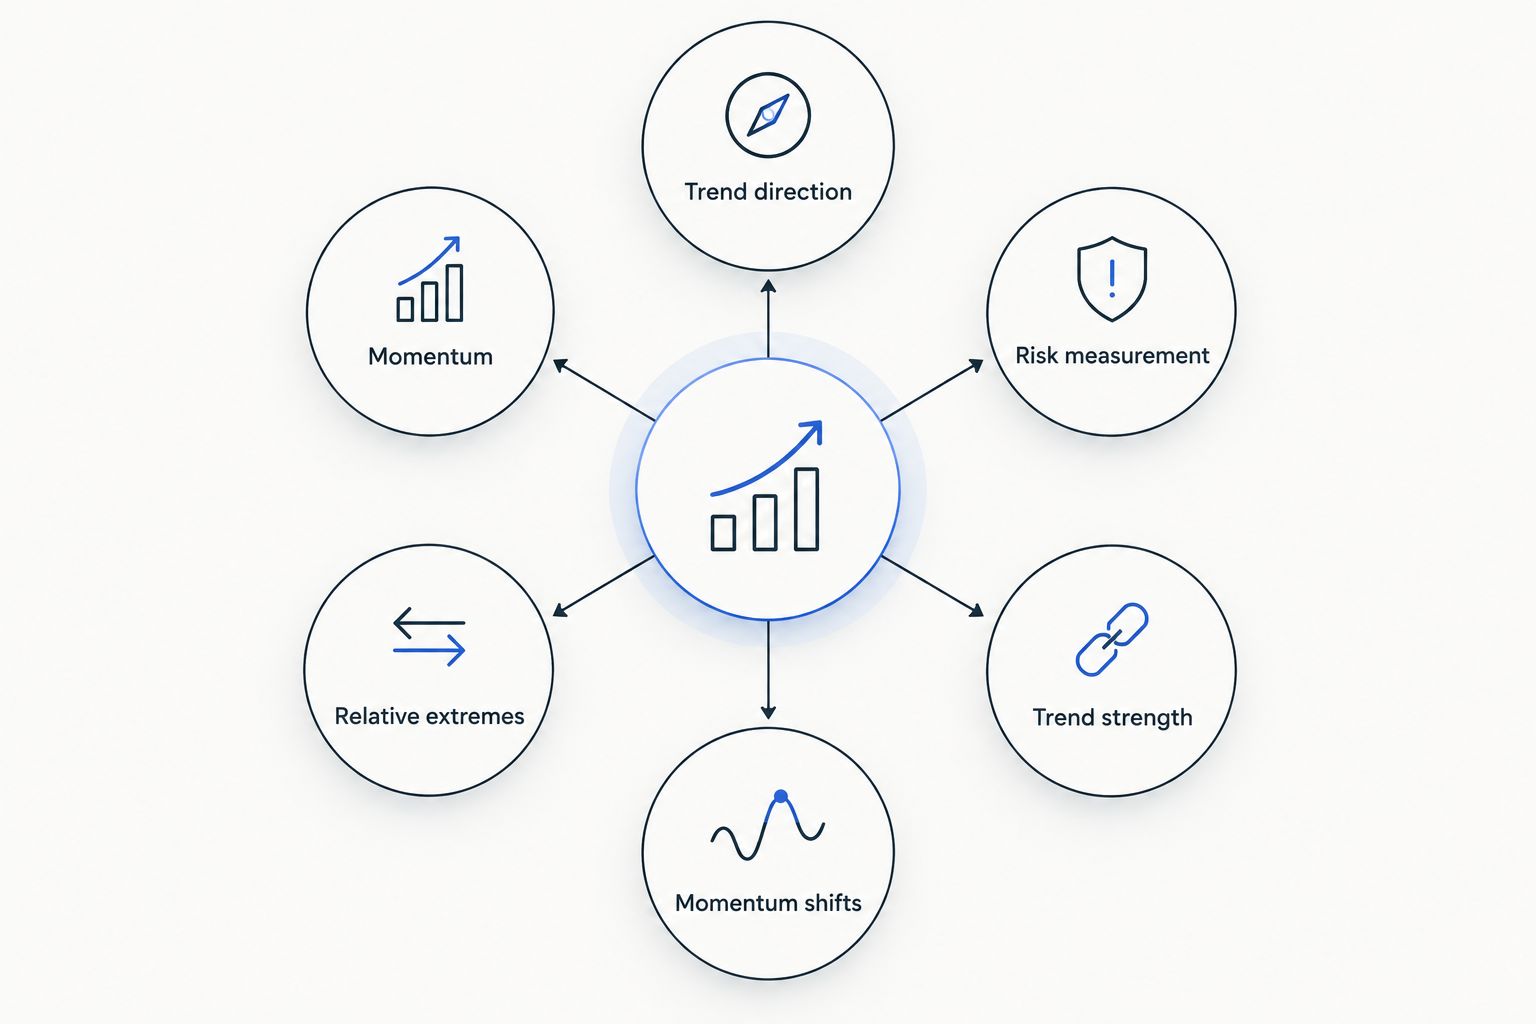
Choose indicators by the questions they answer, not by how many signals appear.
1. Exponential moving average: best for gold trend direction
An exponential moving average, or EMA, smooths price while giving greater weight to recent observations. Its slope and position relative to price help describe the current trend. It reacts to price; it does not anticipate it.
For your 2026 chart review, compare illustrative settings such as a 20-bar EMA and a 50-bar EMA. The shorter calculation responds faster. These settings are examples, not validated gold-trading recommendations.
Price above a rising EMA describes a different condition from price repeatedly crossing a flat EMA. The second pattern makes a simple crossover rule harder to interpret.
EMA pros:
- Makes trend direction easier to see.
- Gives recent prices more influence than older prices.
- Supports comparison between shorter and longer trend windows.
EMA cons:
- Responds after price has already changed.
- Produces repeated crossings during sideways movement.
- Changes materially when you change the chart interval.
Best for: Establishing a readable direction filter before examining momentum.
Verdict: Skip EMA crossovers as standalone entry instructions. Use EMA to describe trend direction.
2. Relative Strength Index: best for gold momentum
The Relative Strength Index, or RSI, compares average recent gains with average recent losses. It produces an oscillator on a scale from 0 to 100. A common calculation uses 14 periods.
Traditional reference levels are 70 and 30 on the RSI scale. Those readings describe relatively strong upward or downward momentum. They do not prove that gold must reverse.
In a persistent advance, RSI can remain elevated while price keeps rising. Read the oscillator alongside the chart structure. An extreme reading without that context is incomplete.
RSI pros:
- Summarizes momentum on a bounded scale.
- Makes momentum changes easier to compare across chart swings.
- Provides a different view from a trend line alone.
RSI cons:
- Can remain elevated or depressed during persistent trends.
- Divergence can appear before a trend continues rather than reverses.
- Shorter settings produce a more reactive reading.
Best for: Assessing whether recent upward or downward momentum is strengthening.
Verdict: Skip automatic reversal trades at RSI extremes. Use RSI as momentum context.
3. Average True Range: best for gold volatility and risk context
Average True Range, or ATR, measures the size of recent price ranges. Its true-range calculation also accounts for gaps relative to the previous close. A common setting is 14 periods.
ATR is expressed in the instrument's price units. It is not a percentage by default. A rising reading means recent ranges have expanded, regardless of whether gold has moved up or down.
This makes ATR useful when reviewing how far price has been moving. It does not calculate your maximum acceptable loss. That requires separate consideration of exposure, position size and account risk.
ATR pros:
- Separates volatility from price direction.
- Includes gaps in its range calculation.
- Helps put chart distances into recent market context.
ATR cons:
- Gives no bullish or bearish signal.
- Reacts to volatility that has already occurred.
- Does not protect against a sudden move beyond recent ranges.
Best for: Reviewing whether a planned chart distance is narrow or wide relative to recent movement.
Verdict: Skip ATR as a directional signal. Use ATR to describe volatility before assessing exposure.
4. Bollinger Bands: best for relative gold price extremes
Bollinger Bands place an upper and lower band around a moving average. The bands expand and contract with standard deviation. A common configuration uses a 20-period simple moving average with bands 2 standard deviations away.
Price near an outer band is extended relative to that calculation window. It is not necessarily mispriced. Gold can continue moving along a band during a persistent trend.
A narrowing band shows lower volatility within the lookback window. It does not tell you which direction the next expansion will take. Keep that distinction clear in your 2026 analysis.
Bollinger Bands pros:
- Shows price relative to a volatility-based envelope.
- Makes volatility expansion and contraction visible.
- Combines a central average with relative price context.
Bollinger Bands cons:
- A band touch does not establish a reversal.
- A contraction does not predict breakout direction.
- Standard-deviation bands do not guarantee that price stays inside them.
Best for: Reviewing relative extension and changes in volatility.
Verdict: Skip automatic buying or selling at band touches. Use Bollinger Bands to describe price context.
5. Average Directional Index: best for gold trend strength
The Average Directional Index, or ADX, measures the strength of directional movement. It belongs to the directional movement system. A common calculation uses 14 periods.
ADX does not identify trend direction on its own. A rising reading can accompany either an advancing or a declining market. Direction requires separate price analysis or the system's directional indicators.
ADX adds context when your question is whether movement is becoming more directional. It does not confirm that a trend will continue. The calculation still depends on historical observations.
ADX pros:
- Separates trend strength from bullish or bearish direction.
- Adds context to moving-average analysis.
- Helps distinguish strengthening directional movement from weakening movement.
ADX cons:
- Cannot tell you whether to buy or sell by itself.
- Often reacts after a directional move develops.
- A fixed threshold does not validate every gold-market setup.
Best for: Assessing trend strength after you have identified direction separately.
Verdict: Skip ADX as a standalone trade trigger. Use ADX when trend strength is the unresolved question.
6. MACD: best for changes in gold momentum
Moving Average Convergence Divergence, or MACD, compares a faster EMA with a slower EMA. A signal line smooths the resulting difference. The histogram shows the distance between MACD and its signal line.
The conventional configuration uses 12-period and 26-period EMAs with a 9-period signal line. These are established defaults, not evidence of optimal settings for gold in 2026.
A changing histogram describes a changing relationship between the lines. It does not mean price must reverse. Because MACD uses moving averages, it shares information with an EMA-based chart.
MACD pros:
- Makes changes in the moving-average relationship visible.
- Provides a histogram for comparing momentum shifts.
- Combines trend-related and momentum-related information.
MACD cons:
- Lags the price observations used in its calculation.
- Repeats some information already present in EMA analysis.
- Can produce repeated crossings during sideways conditions.
Best for: Reviewing momentum shifts through the relationship between moving averages.
Verdict: Skip MACD as supposedly independent confirmation of EMA signals. Use MACD when its momentum view adds clarity.
How these indicators are ranked
This is a function-based ranking. It is not a backtest or a claim about returns. The criteria are clarity, distinct information, visible limitations and relevance to the question being asked.
EMA ranks first because direction is a useful starting question. RSI follows for momentum. ATR addresses volatility without claiming to forecast direction.
Bollinger Bands, ADX and MACD serve more specific needs. Their lower positions do not make them inferior tools. They require a clearer reason for inclusion.
No indicator receives a profitability score. Such a score would require a defined instrument, timeframe, entry rule, exit rule and test period.
Which gold trading indicators should you choose?
Start your chart review with EMA for direction and ATR for volatility. Add RSI when momentum is the question you still need to answer. This is an analytical sequence, not a trading system.
For a 2026 review routine, keep each step separate:
- Direction: Is price above or below the EMA? Is the average rising, falling or flat?
- Volatility: Is ATR expanding or contracting? What does that say about recent movement?
- Momentum: Does RSI support the direction of the recent price swing?
- Structure: Where are the visible swing highs and lows?
- Exposure: What loss does the contemplated position create if the market moves against it?
Do not count EMA and MACD agreement as two unrelated sources of evidence. Both depend on moving-average calculations. Agreement can reflect shared inputs.
VCG Markets provides gold access within its multi-asset offering. Chart tools help you inspect market conditions. They do not remove the risks of CFD trading or determine whether a position suits your circumstances.
FAQ
What's the best indicator for gold trading?
EMA is the starting choice in this guide for reading gold's trend direction. It smooths price and gives recent observations more weight. It does not predict the next move or establish a profitable trade.
Is RSI better than MACD for gold trading?
RSI and MACD answer different momentum questions. RSI compares recent gains with losses on a bounded scale. MACD describes the relationship between moving averages and overlaps more with EMA analysis.
What EMA settings should I use for gold?
There is no universally best EMA setting for gold. A 20-bar EMA and a 50-bar EMA illustrate shorter and longer calculation windows. Their meaning changes with the chart interval.
Does an overbought RSI mean I should sell gold?
An overbought RSI reading is not a standalone instruction to sell gold. Strong upward momentum can keep RSI elevated while price continues rising. Read the price structure before interpreting the oscillator.
Can ATR tell me whether gold will rise or fall?
ATR measures volatility, not direction. A rising ATR means recent price ranges have expanded. It does not identify whether the next move will be upward or downward.
Are Bollinger Band touches reliable gold entry signals?
A Bollinger Band touch alone does not establish a reliable entry. Price can remain near an outer band during a persistent trend. The bands describe relative extension within their calculation window.
Can I trade gold with VCG Markets?
VCG Markets offers access to gold through CFD trading as part of its multi-asset offering. CFDs provide exposure to price changes rather than ownership of physical gold. Margin trading carries the risk of amplified losses.
Do I need all six indicators on my gold chart?
You do not need all six indicators to answer a specific chart question. Start with the function you need and remove overlapping tools. More indicators do not create independent evidence when they use similar calculations.
One last thing
Two agreeing indicators can be one idea shown twice. EMA and MACD both depend on moving averages. Bollinger Bands also place an average at the centre of their calculation.
For your next 2026 chart review, write one question beside each indicator. If two tools answer the same question without adding useful context, remove one. A clearer chart is easier to inspect. It is not a promise of a better trading outcome.

信息
VCG Markets Ltd 是获准提供投资服务的持牌实体。公司注册于毛里求斯共和国(公司编号 188485),并由毛里求斯金融服务委员会依据第 GB22200388 号牌照授权和监管,注册办事处位于 The Cyberaty Lounge, Ground Floor, The Catalyst, Silicon Avenue, 40 Cybercity, 72201 Ebene, Republic of Mauritius。
VCG Markets (Seychelles) Ltd 是获准提供证券交易商服务的持牌实体。公司注册于塞舌尔共和国(公司编号 8438443-1),并由塞舌尔金融服务管理局依据第 SD243 号牌照授权和监管,注册办事处位于 House of Francis, Room 301(B), Ile Du Port, Mahe, Republic of Seychelles。
本网站由 VCG Tech Limited(公司编号 HE452446)运营,注册办事处位于 Agias Fylaxeos & Zinonos Rossidi, 2, 1st Floor, 3082 Limassol, Cyprus。VCG Tech Limited 作为商户公司处理客户的入金与出金。
保证金外汇和差价合约交易属于杠杆产品,可能导致损失超过您的存入资金。投资价值可升可跌,您收回的金额可能少于最初投资额。请确保您充分理解所涉风险,并考虑此类交易是否适合您。
为保证服务质量、合规及培训目的,电话通话与电子通讯可能被录音和监控。
本网站信息仅供一般参考,不构成投资建议、推荐或从事任何投资活动的要约。
VCG Markets 不提供税务建议。税法可能变更,且各司法管辖区之间可能存在差异。
本网站信息不面向美国、比利时、加拿大、新加坡居民,或任何访问此类信息将违反当地法律或法规的司法管辖区。
VCG Markets © 2026, Inc. 保留所有权利。


