Trading Performance · 2026
Calculate maximum drawdown by finding the largest percentage decline from an account equity peak to a subsequent trough within your chosen period. Subtract the trough from its preceding peak, divide by that peak, then multiply by 100. Use a cash-flow-adjusted series when deposits or withdrawals occur, and include open-position losses when measuring account risk.
Key takeaways
- How to calculate maximum drawdown: measure the largest peak-to-trough percentage decline in account equity.
- Equity drawdown includes open-position results. Balance drawdown leaves them out.
- Adjust deposits and withdrawals before comparing trading performance across periods.
- VCG Markets trading reviews should separate drawdown depth from recovery time and trading behaviour.
01Measure the decline
02Check the data
03Interpret the result
01
How to calculate maximum drawdown
Start with a dated equity series. Your trading balance and equity measure different things. Equity includes the current result of open positions. That distinction matters when losses remain unrealised.
Maximum drawdown = largest value of [(running equity peak − current equity) ÷ running equity peak] × 100.
- Choose the measurement period and observation frequency.
- Read the equity observations in chronological order.
- Track the highest equity recorded up to each observation.
- Calculate each decline against that running peak.
- Select the largest percentage decline and record its peak and trough dates.
The order matters. An account low that occurred before a later high cannot be paired with that high. Drawdown measures a decline after a peak, not the distance between any two values.
For a 2026 review, state whether the calculation begins at the review window or carries forward an earlier high-water mark. Those conventions answer different questions. A window-only calculation measures declines inside that window.
02
Why the measurement basis matters
A closed-trade report does not show every fluctuation in account value. An open position can move against you before it closes. A balance-only calculation excludes that interim movement.
| Basis | Suited to | Limitation |
| Equity drawdown | Reviewing account declines including open-position results | Requires equity observations frequent enough for the review |
| Balance drawdown | Reviewing booked results and account entries | Excludes unrealised gains and losses |
Use equity drawdown when your question concerns the account decline experienced while positions were open. Keep balance drawdown separately if you also want to examine booked results. Do not compare the two as interchangeable measures.
Also separate percentage drawdown from monetary drawdown. Percentage drawdown divides the decline by its preceding peak. Monetary drawdown records the account-currency amount. Their largest declines need not occur during the same episode.
03
Build a repeatable spreadsheet calculation
Create columns for timestamp, current equity, running peak and drawdown percentage. Use a consistent account currency. Sort the observations from earliest to latest before applying formulas.
- Current equity: enter the observed account equity at each timestamp.
- Running peak: take the highest equity from the first observation through the current row.
- Drawdown percentage: divide the difference between running peak and current equity by running peak.
- Maximum drawdown: select the largest value in the drawdown column.
Format the drawdown ratio as a percentage. Do not multiply by 100 and then apply percentage formatting again. That would scale the displayed result twice.
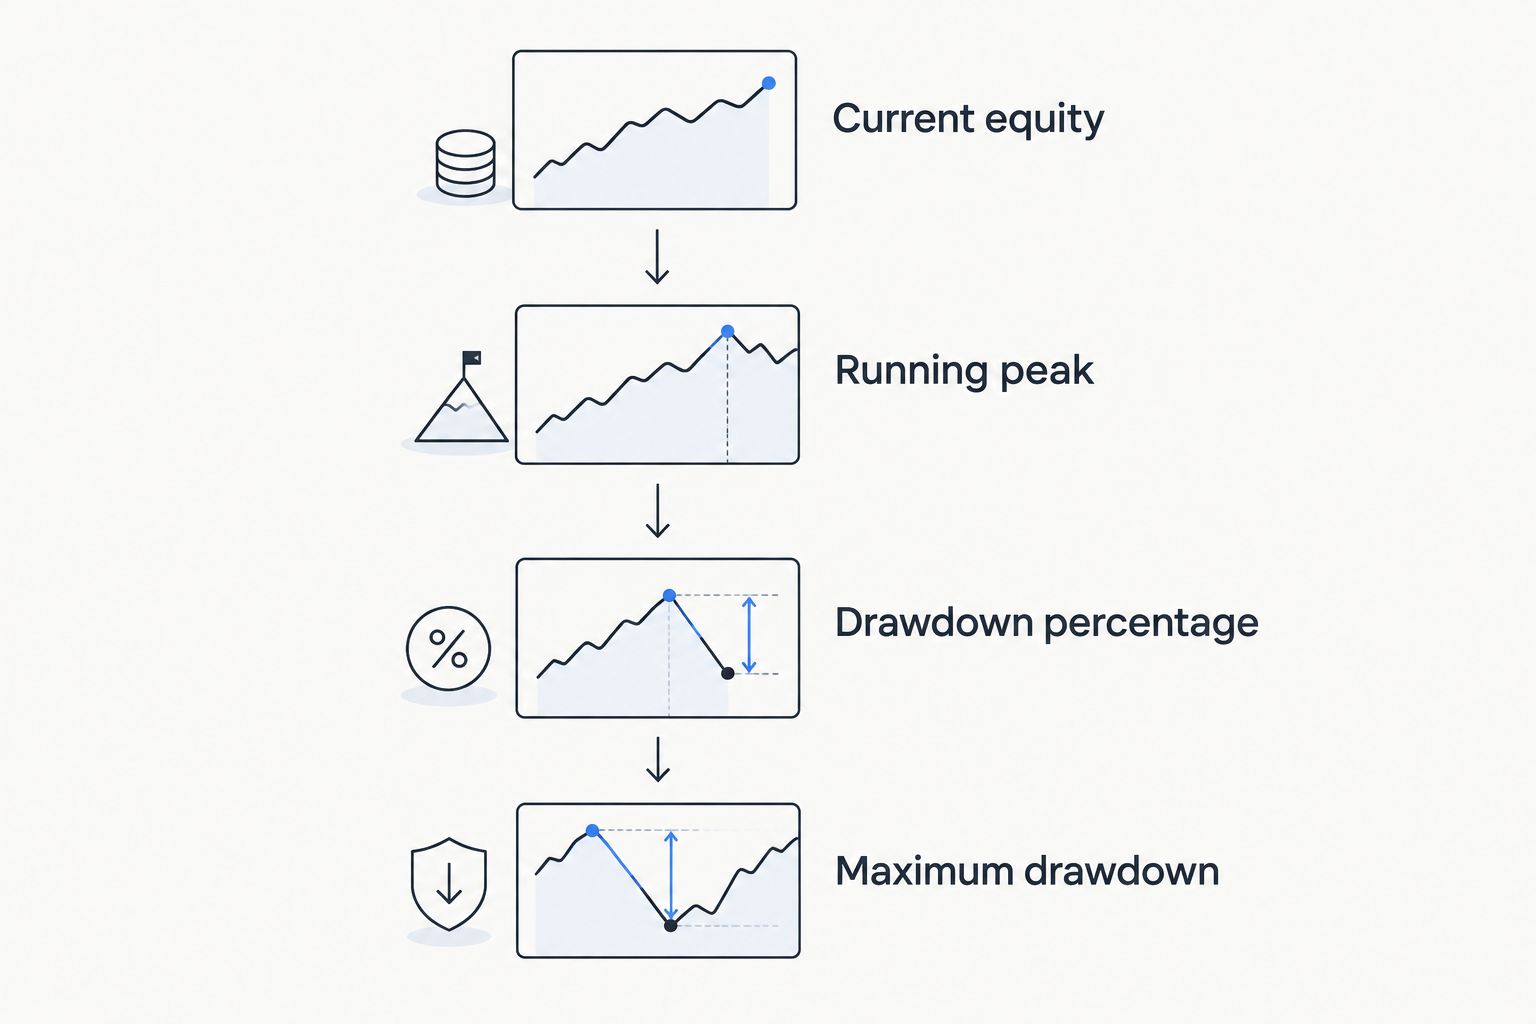
Each equity observation is compared with the highest equity recorded before or at that observation.
Check the row containing the largest decline. Its running peak must correspond to an actual earlier observation. Keep the timestamp of that peak alongside the trough timestamp so the result remains traceable.
At a new equity high, drawdown is 0%. The standard percentage formula assumes a positive running peak. A zero denominator makes it undefined. Negative account values require explicit treatment rather than a silently accepted spreadsheet result.
04
Why maximum drawdown varies between reports
Different calculations can describe different parts of the same trading history. Before comparing your 2026 reports, check the measurement rules. A shared label does not establish a shared method.
- Observation frequency. End-of-day snapshots exclude movements between snapshots. More frequent observations can capture peaks and troughs absent from the daily series.
- Measurement window. Changing the start date changes which preceding peaks are included. Changing the end date changes which troughs are available.
- Equity or balance. Including unrealised results changes the account-value path. Closed-trade records alone cannot reconstruct every open-position fluctuation.
- External cash flows. Deposits increase raw equity without representing trading gains. Withdrawals reduce raw equity without representing trading losses.
- Costs and account entries. Compare series with consistent treatment of commissions, financing and other booked adjustments. Do not deduct costs twice.
- Incomplete observations. Missing timestamps can remove the actual peak or trough. A calculation remains limited to the observations it contains.
Treat missing data in a trading review as a measurement issue. Do not label a daily-snapshot result as an intraday maximum. Record the source, frequency and coverage beside the figure.
05
How do deposits and withdrawals affect drawdown?
Deposits and withdrawals change account equity independently of trading performance. A deposit can conceal part of a trading decline in the raw equity curve. A withdrawal can create an apparent decline without a trading loss.
For performance measurement, use a consistently cash-flow-adjusted return series. One approach is to calculate returns between external cash flows and link those returns into a performance index. Then calculate drawdown on that index.
Cash-flow timing matters. A return calculation must distinguish money present during a trading interval from money added at its end. Simply subtracting total deposits from every historical equity observation does not preserve that timing.
Keep the original account record alongside the adjusted series. For a 2026 performance review, label the adjusted result clearly. Raw equity remains useful for understanding the actual funds in the account. It answers a different question.
06
What does maximum drawdown leave out?
Maximum drawdown describes the deepest observed decline. It does not describe how often losses occurred or how long recovery took. Record the peak date, trough date and recovery date separately.
Recovery occurs when the same measurement series regains its preceding peak. An unrecovered drawdown still counts. Do not wait for recovery before including the decline in your report.
A 50% decline requires a 100% gain from the remaining value to regain the peak. This is arithmetic, not a return forecast. The recovery percentage uses the smaller post-loss value as its denominator.
A historical maximum is not a future loss limit. It also does not identify the cause of the decline. Examine position sizes, overlapping exposures and execution records before assigning an explanation.
Compare like with like in your 2026 review. Keep the observation frequency, cash-flow treatment and calculation basis consistent. A lower reported drawdown alone does not establish a stronger trading process.
FAQ
How do I calculate maximum drawdown in my trading account?
Subtract each equity observation from its running peak, divide by that peak and express the result as a percentage. The largest percentage decline is maximum drawdown for that observation series.
Should I use balance or equity for maximum drawdown?
Use equity when measuring account declines that include open-position results. Balance drawdown excludes unrealised results and should be labelled separately.
Can I calculate maximum drawdown from closed trades alone?
Closed trades can support a balance-based calculation when combined with the relevant account entries. They do not show every unrealised equity decline while positions were open.
Does maximum drawdown include deposits and withdrawals?
Raw equity includes the effect of deposits and withdrawals. For trading-performance measurement, calculate drawdown on a consistently cash-flow-adjusted series so external funding is not treated as trading performance.
Does a drawdown have to recover before it counts?
An unrecovered drawdown still counts toward maximum drawdown. Its trough is the lowest observed value after the relevant peak within the measurement window.
Why is my daily drawdown different from my intraday drawdown?
Daily snapshots exclude equity movements between their observation times. Intraday observations can capture a peak or trough that the daily series misses.
Does a smaller maximum drawdown mean my strategy is safer?
A smaller historical maximum drawdown does not establish a future risk limit. Compare the measurement period, observation frequency, cash-flow treatment and exposure before interpreting the difference.
Conclusion
Keep a short measurement note beside your result: period, account currency, equity or balance, observation frequency and cash-flow treatment. Add the peak and trough timestamps. That makes the number reproducible rather than merely reportable.
One final check: extending an otherwise unchanged observation series cannot reduce its historical maximum drawdown. A lower figure after an extension signals a changed window, revised data or a different calculation. Check the method before interpreting the improvement.
Measure the decline. Preserve the dates. State the method.
Related guides
- How correlated currency pairs create hidden exposure
- Review trade holding time
- Build a weekly trading review workflow
This article is for educational purposes only and does not constitute investment advice. Trading CFDs and other leveraged products carries a high level of risk and may not be suitable for all investors.


