Oil Trading · Technical Analysis
The best indicators for oil trading in 2026 depend on the question: moving averages for trend, average true range for volatility, relative strength index for momentum, Bollinger Bands for relative price extremes, and volume-weighted average price for session context. Moving averages are the starting point for this guide, not a standalone trading signal.
Key takeaways
- The best indicators for oil trading separate trend, momentum, volatility and session context rather than repeat the same signal.
- Moving averages suit trend analysis. Average true range measures movement, not direction.
- Relative strength index and Bollinger Bands describe conditions. Neither confirms that an oil price reversal must follow.
- Volume-weighted average price requires a defined session and a clear understanding of the volume feed.
01Choose the question
02Understand each limitation
03Review the process
01 · Why the indicator’s job matters
Oil indicators describe market data. They do not explain every change in supply expectations, demand expectations or positioning. A chart signal and the reason behind a price move are different things.
That distinction matters around new information. Oil supply and demand reactions belong beside technical analysis, not underneath it. An indicator calculated from previous prices cannot know the content of the next announcement.
VCG Markets offers oil trading within its multi-asset range. For your 2026 chart setup, start with a defined analytical question rather than a screen full of signals.
What makes an indicator useful?
- Distinct purpose: it answers a question your other tools do not already answer.
- Readable calculation: you understand which prices or volumes produce the reading.
- Timeframe fit: the lookback matches the period you are analysing.
- Feed suitability: the underlying instrument and data source are clear.
- Visible limitations: you know when the reading becomes misleading.
The ranking below follows those criteria. It orders analytical roles rather than claiming that one indicator produces higher returns.
Oil indicators at a glance
| Indicator | Suited to | Distinct feature | Key limitation |
| Moving averages | Trend context | Smooth price fluctuations | Lag and whipsaws |
| Average true range | Volatility context | Includes gaps in its range calculation | Does not show direction |
| Relative strength index | Momentum assessment | Bounded momentum scale | Extreme readings can persist |
| Bollinger Bands | Relative price extremes | Bands adapt to dispersion | A band touch is not a reversal |
| Volume-weighted average price | Session benchmarking | Weights prices by recorded volume | Depends on volume and session definitions |
02 · Moving averages for trend context
Moving averages smooth price data across a chosen lookback. A simple moving average weights observations equally. An exponential moving average gives more weight to recent prices.
Suited to: identifying whether your chosen timeframe shows a rising, falling or relatively flat price trend. The slope and price relationship matter together.
A 20-bar average covers 20 completed observations when calculated on completed bars. On a daily chart that represents 20 daily bars. On an hourly chart it represents 20 hourly bars. The setting is not a fixed amount of calendar time.
Moving average strengths:
- Makes the direction of a price sequence easier to inspect.
- Provides a consistent reference across chart reviews.
- Separates a trend question from a volatility question.
Moving average limitations:
- Responds after the prices used in its calculation.
- Produces repeated crossings in sideways conditions.
A crossover is an observed event. It does not establish that the next move will continue. Shortening the lookback increases responsiveness but also exposes the line to more short-term fluctuations.
Analytical verdict: Hold for trend context. Skip as a standalone entry rule.
03 · Average true range for volatility context
Average true range measures movement rather than direction. Its true-range calculation considers the current high and low alongside the previous close. This allows gaps to enter the calculation.
Suited to: comparing the current movement environment with the same instrument’s recent history. A conventional setting uses 14 bars. That is a calculation window, not a forecast horizon.
Read the result in the instrument’s quoted price units. A larger reading means recent ranges have expanded under that calculation. It does not establish whether buyers or sellers control the next move.
Average true range strengths:
- Captures movement that a direction-only reading misses.
- Includes gaps rather than measuring only high-to-low distance.
- Provides context for reviewing the scale of price fluctuations.
Average true range limitations:
- Cannot identify a bullish or bearish direction.
- Reflects movement already observed rather than a guaranteed future range.
For a 2026 review, keep the symbol and timeframe consistent before comparing readings. Changing the chart interval changes the movement being measured. Average true range also cannot guarantee an execution price or prevent a gap beyond an intended exit.
Analytical verdict: Hold for volatility context. Skip as a directional signal.
04 · Relative strength index for momentum assessment
Relative strength index compares recent gains with recent losses through a bounded calculation. Its scale runs from 0 to 100. The familiar 70 and 30 levels describe conventional overbought and oversold zones.
Suited to: examining momentum strength and changes in that strength. An elevated reading is not proof that oil is fundamentally expensive.
Relative strength index strengths:
- Places momentum on a consistent scale.
- Makes persistent strength or weakness visible.
- Supports comparison between price swings and momentum swings.
Relative strength index limitations:
- Can remain elevated or depressed during a sustained trend.
- Divergence does not specify when a reversal will occur.
Price can make a higher high while the indicator makes a lower high. That is a momentum divergence. It describes disagreement between the series, not a completed reversal.
Keep that distinction in your notes. “Momentum weakened” records an observation. “Price must fall” adds a conclusion the indicator cannot establish. The first statement remains useful even when the trend continues.
Analytical verdict: Hold for momentum assessment. Skip automatic reversal assumptions.
05 · Bollinger Bands for relative price extremes
Bollinger Bands place upper and lower bands around a moving average. Band distance depends on standard deviation. The display therefore combines a central price reference with a measure of recent dispersion.
Suited to: assessing where price sits relative to its recent distribution. Band width also shows whether that distribution is contracting or expanding.
Bollinger Bands strengths:
- Connects price location with changing dispersion.
- Makes compression and expansion visible.
- Provides a reference for comparing successive price moves.
Bollinger Bands limitations:
- Does not identify the direction of a move following compression.
- Does not make an upper-band touch a sell instruction.
During a sustained trend, price can repeatedly approach the same outer band. Treating every touch as exhaustion mistakes persistence for a reversal signal.
Oil chart construction also matters. Futures rollover price adjustments affect how a continuous history is assembled. Understand that history before interpreting an apparent jump or a sudden change in band width.
Analytical verdict: Hold for relative price context. Skip band-touch rules without further conditions.
06 · Volume-weighted average price for session benchmarking
Volume-weighted average price weights recorded prices by their associated volume. Its meaning depends on the observations included. The session start and volume source are part of the definition.
Suited to: comparing intraday prices with a volume-weighted session reference. It answers a different question from whether the longer-term trend is rising.
Volume-weighted average price strengths:
- Combines recorded trading activity with price.
- Provides a defined benchmark within a session.
- Supports consistent review when the data and reset rules remain unchanged.
Volume-weighted average price limitations:
- Tick volume is not the same as exchange-traded contract volume.
- Different session boundaries can produce different readings.
Confirm what your feed measures before interpreting the line. A broker-specific feed does not automatically represent all trading in the underlying oil market. An exchange futures feed represents activity in the relevant contract, not every oil transaction.
For a 2026 comparison, document both the session boundary and volume definition. Otherwise, an apparent disagreement between charts can be a data-definition difference rather than a market signal.
Analytical verdict: Hold when the feed and session are understood. Skip market-wide conclusions from an unidentified volume source.
07 · Build a setup you can actually review
Start with the question. Choose trend context, volatility context or momentum assessment before choosing the indicator. Add another tool only when it answers a different question.
Moving averages and Bollinger Bands share moving-average information. Agreement between them is not independent confirmation. More lines can repeat the same evidence.
- Define the question: write what the chart is meant to establish.
- Check the feed: identify the instrument, timeframe and session.
- Record the rules: specify the conditions before inspecting results.
- Review execution: distinguish a chart observation from a tradable fill.
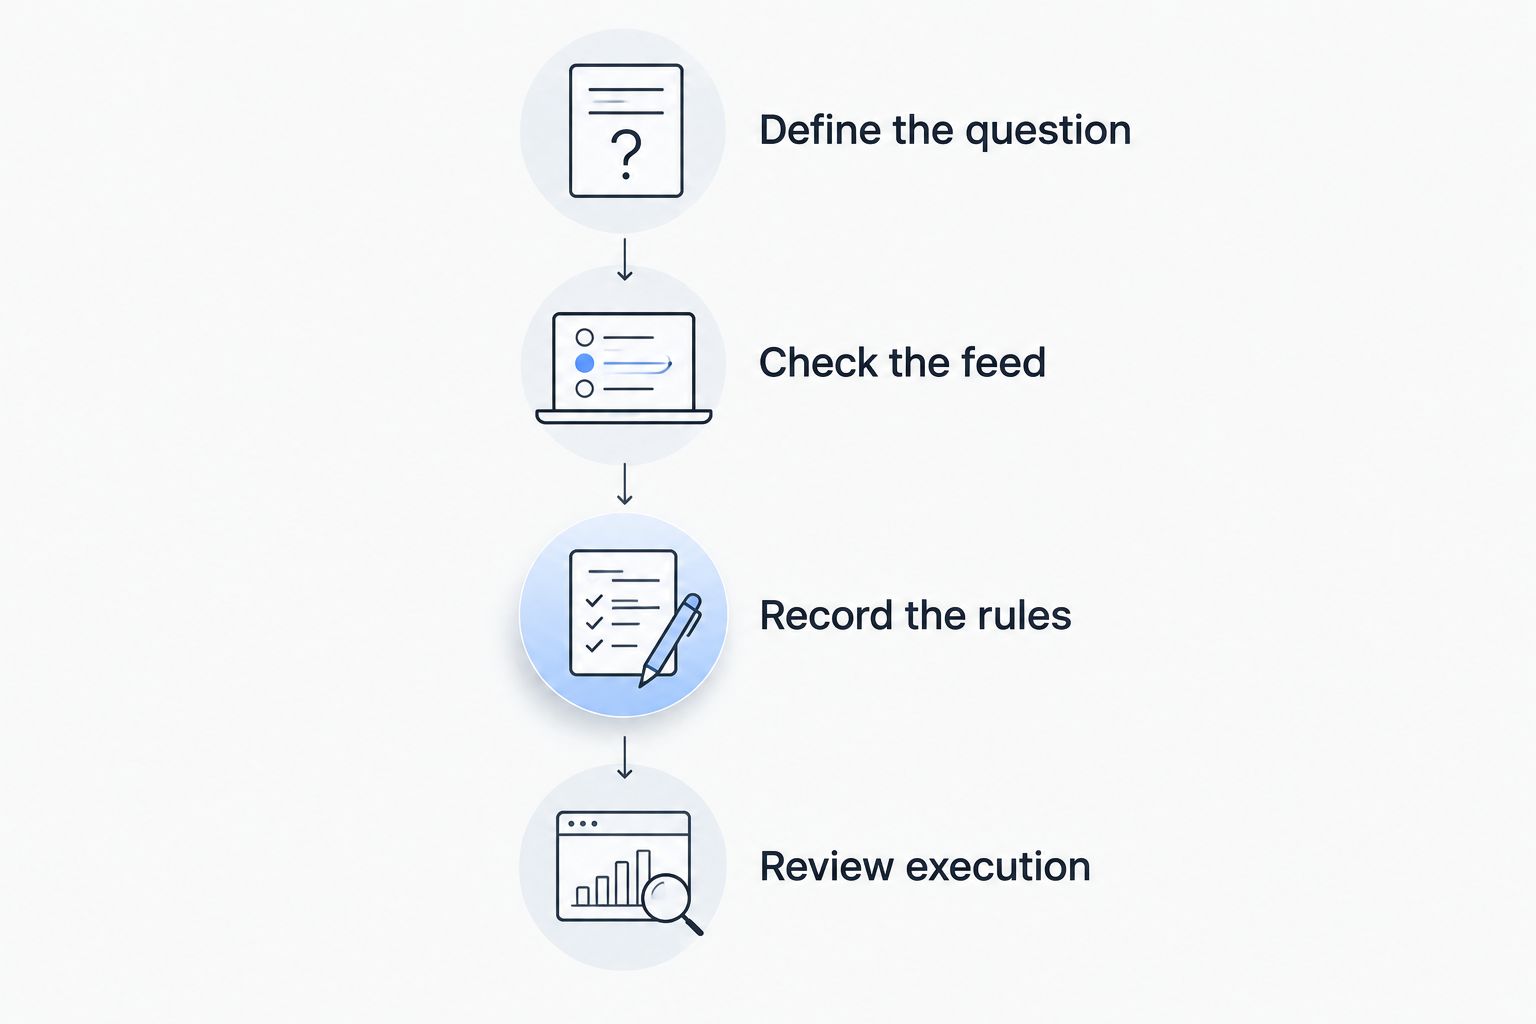
A repeatable review starts with the question and ends with execution, not another indicator.
Historical testing needs the same discipline. A completed candle’s closing value is not available before that candle closes. Using it earlier introduces information that the decision could not have contained.
When assessing backtesting software, matching oil data, session boundaries and execution assumptions matters more than the appearance of the results chart. A simulation that ignores spreads or gaps answers a different question from one that includes them.
Separate rule development from evaluation. Repeatedly changing settings to improve the same historical result makes that result less informative about unseen data. Keep a record of each change and its reason.
For your 2026 review, preserve the settings you actually used. Record which observations supported the decision and which contradicted it. This keeps an indicator review from becoming a search for confirmation.
How the indicators were ranked
The order reflects analytical roles, calculation clarity and data requirements. Moving averages establish trend context first. Average true range adds a different dimension. Momentum, relative price extremes and session benchmarking answer narrower questions.
This is not a performance league table. No return, win-rate or accuracy ranking is claimed. Different settings and market conditions change the observations each tool produces.
Which oil indicator should you choose?
For an undecided reader, moving averages provide the starting point for trend analysis. Add average true range when the question concerns movement size. Choose the remaining tools only for their specific analytical roles.
One last thing: an indicator can change without a new directional move. A rolling window removes older observations as new ones enter. Record the lookback before explaining a changed reading as fresh buying or selling pressure.
Choose a question first. Then choose the indicator that answers it.
FAQ
What are the best indicators for oil trading?
Moving averages suit trend context, average true range suits volatility, and relative strength index suits momentum. Bollinger Bands describe relative price extremes. Volume-weighted average price provides session context when the volume feed is understood.
Is relative strength index better than moving averages for oil?
Neither replaces the other because they answer different questions. Relative strength index measures momentum. Moving averages smooth prices to support trend analysis.
Does an overbought reading mean oil prices will fall?
No. An overbought reading describes the indicator’s calculated condition, not a required reversal. Strong momentum can keep the reading elevated while prices continue rising.
Can average true range show where oil will move next?
Average true range does not show direction. It measures recent movement and includes gaps in its range calculation. It does not guarantee the size of the next move.
Can I use volume-weighted average price on any oil chart?
Its interpretation depends on the chart’s volume data and session definition. Confirm whether the feed uses traded contract volume or tick volume. Do not treat them as interchangeable.
Which timeframe should I use for oil indicators?
Use the timeframe that matches the analytical question and your documented process. The same lookback measures different periods on hourly and daily charts. Keep the interval consistent when comparing readings.
Does VCG ONE predict oil prices?
VCG ONE scores trader performance across eight behavioural dimensions in real time. Behavioural analysis is different from an oil-price forecast. It does not promise a trading outcome.
Related guides
This article is for educational purposes only and does not constitute investment advice. Trading CFDs and other leveraged products carries a high level of risk and may not be suitable for all investors.


