المنزلWhy your chart price can differ from your execution price
Why your chart price can differ from your execution price
Oct 22, 2026
Your chart price can differ from your execution price because the chart and the order can reference different quotes at different times. A buy normally executes against the ask. A sell normally executes against the bid. The spread explains a quote-side difference; price movement during execution can create a separate difference called slippage.
TL;DR
- The bid ask price chart difference starts with which quote your chart displays.
- Buy orders normally execute against the ask; sell orders normally execute against the bid.
- Spread compares simultaneous quotes. Slippage compares an execution with its reference price.
- VCG Markets traders should compare fills with executable quotes, not candles alone.
Quote side · Execution timing · Trade records
01. Why can your chart price differ from your execution price?
A candle is not a complete record of the quotes available to execute your order. It summarises a selected price stream over an interval. Your order uses the executable side of the market under the instrument’s execution rules.
Start with these distinctions:
Bid
- What it represents: The quoted price at which you can sell, subject to execution conditions
- Useful for: Comparing sell-side quotes
- Limitation: Does not show the ask required for a buy
Ask
- What it represents: The quoted price at which you can buy, subject to execution conditions
- Useful for: Comparing buy-side quotes
- Limitation: Does not show the bid required for a sell
Last traded price
- What it represents: The price of the latest reported transaction
- Useful for: Seeing where a transaction occurred
- Limitation: Does not guarantee the next executable price
Midpoint
- What it represents: The price halfway between the bid and ask
- Useful for: Viewing the centre of the quoted spread
- Limitation: Is not automatically an executable quote
If a chart displays bid prices, a buy fill can sit above the visible candle because the order executed against the ask. That difference does not, by itself, establish slippage.
For the timing component, read the guide to positive and negative slippage. Keep the concepts separate when reviewing a trade. Spread describes the gap between bid and ask at the same moment. Slippage describes an execution difference against a relevant reference price.
02. Why this matters
A fill comparison needs matching evidence. Comparing a buy execution with a bid candle mixes quote sides. Comparing an execution with a candle captured later mixes timestamps.
For a 2026 trading review, preserve the instrument name, order direction and execution record. Then identify the chart’s price source. A screenshot without those details cannot explain the difference reliably.
This also matters when you review a strategy. A chart-based entry assumption is not necessarily an executable entry. If you ignore the spread, your review leaves out the distinction between buying and selling at the quoted market.
Check the reference before judging the result. A visible mismatch deserves investigation. It does not establish its cause.
03. Which price does your chart actually display?
Do not assume every chart displays the bid. Depending on the instrument and feed, a chart can use bid, ask, last traded prices or another defined reference.
Check the chart settings and the instrument documentation. Look for an option to display the ask line where supported. Also check whether the chart uses ordinary candles or a transformed chart type.
A transformed candle is a calculation. Its displayed values should not automatically be treated as transaction prices. Even an ordinary candle only records the selected stream’s open, high, low and close for that interval.
Bid charts
A bid chart helps you inspect sell-side quote movement. Its limitation appears when you compare it directly with a buy execution. The ask is missing from that comparison unless you display or retrieve it separately.
Last-price charts
A last-price chart shows reported transactions. Its strength is transaction context. Its limitation is that the latest transaction does not tell you the current bid, ask or executable quantity.
Midpoint charts
A midpoint chart tracks the centre of the spread. It helps separate central quote movement from either side. Its limitation is execution: neither a buy nor a sell is automatically entitled to that midpoint.
For your 2026 records, write down the chart basis alongside the instrument. Do not rely on the chart’s appearance to identify its underlying data.
04. How do you check the difference step by step?
Match the instrument, quote side and timestamp before comparing prices. Use the order record as the starting point. A candle screenshot is supporting evidence, not a substitute for the execution details.
- Match the instrument. Copy the full symbol from the execution record. Check the contract type and any expiry. Similar names do not prove that two charts track the same instrument.
- Check direction. Identify whether the executed order bought or sold. Closing a long position normally means selling. Closing a short position normally means buying.
- Identify chart basis. Confirm whether the visible chart uses bid, ask, last or midpoint prices. Check the feed as well as the display settings.
- Match timestamps. Align the execution time with the quote record. Check time zones and timestamp precision. A candle covering an interval cannot identify every quote within it.
- Review execution. Compare the relevant quote with the fill. Check for partial fills and whether the displayed execution price represents an average.
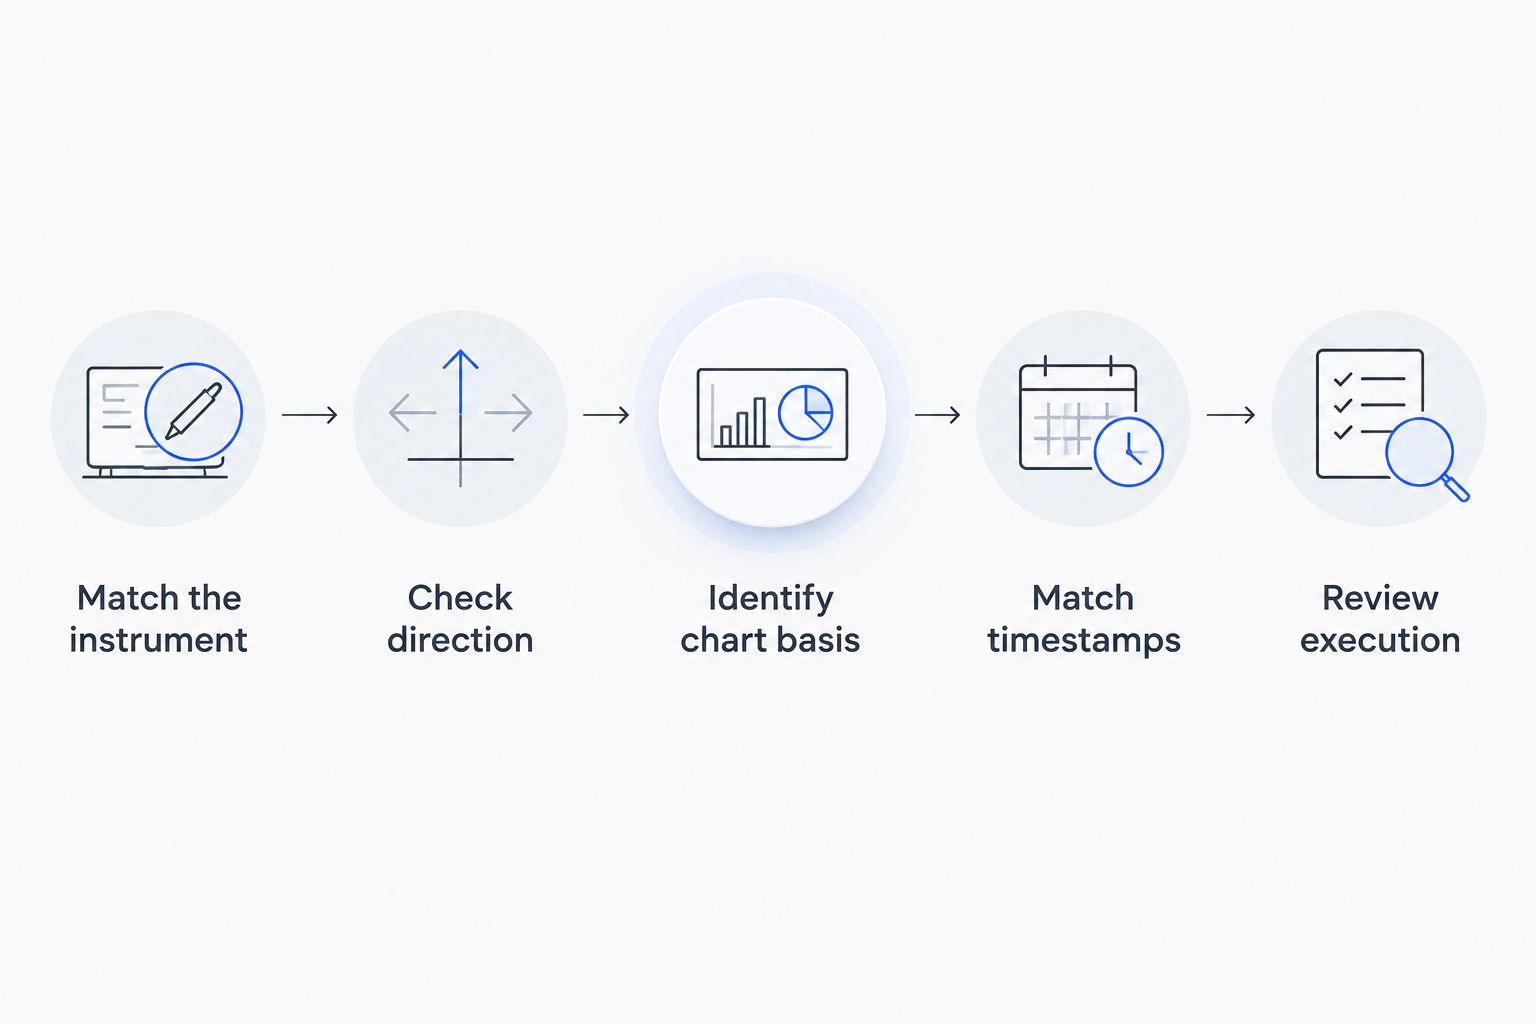
Match the reference first. Then investigate the remaining difference.
Keep an unedited copy of the trade record. If you contact support, provide the order identifier and the exact comparison you are making. Ask which quote stream the chart uses and which execution rules applied.
A useful request is specific: identify the order, state its direction and ask for the relevant quote at execution. Avoid sending only a cropped candle with no symbol or timestamp.
05. Why does the chart-to-execution difference vary?
The visible gap depends on more than the spread. These factors affect what you see and what the order can execute against:
- Quote basis. A bid chart and an ask-side buy execution represent different sides of the market. A last-price chart introduces another reference entirely.
- Spread changes. The bid-ask gap changes as quotes change. A spread observed after execution does not establish the spread that applied during execution.
- Timing. Quotes can move between your decision, order submission and execution. A screenshot taken after the fill captures a different moment.
- Liquidity and size. An order can require execution at more than one price when the executable quantity at a quoted level is insufficient.
- Feed and contract differences. Different providers or different contracts can show different prices. Matching the underlying market name is not enough.
- Order instructions. Market orders, limit orders and stop orders impose different conditions. Their behaviour must be assessed against the relevant execution policy.
For a 2026 execution check, record these factors separately. Do not label the entire difference as spread or slippage before checking the evidence.
A wide spread and an adverse price movement can occur together. Equally, a chart mismatch can come from comparing different instruments. The investigation should establish which explanation fits the record.
06. How do order types change the comparison?
Order instructions determine what you ask the platform to do. They do not make the chart itself an execution guarantee.
Market order
- Main purpose: Seek execution at the available market
- Advantage: Prioritises execution rather than a specified limit
- Limitation: Does not guarantee the displayed price
Limit order
- Main purpose: Set a permitted execution price
- Advantage: Restricts the acceptable price under its instructions
- Limitation: Does not guarantee a fill
Stop order
- Main purpose: Activate an order when its trigger condition is met
- Advantage: Makes activation conditional on a specified level
- Limitation: A stop-market fill is not guaranteed at the trigger
A buy limit sets a maximum acceptable buy price. A sell limit sets a minimum acceptable sell price. Execution still depends on the order’s terms and the available market.
A stop-market order has a different purpose. The stop level activates the market order. If prices move through that level, the eventual execution can differ from the trigger.
Stop-limit orders add a limit condition after activation. That introduces a trade-off: the price restriction can prevent execution. Check which order types your instrument supports rather than assuming every stop behaves alike.
When reviewing an order in 2026, distinguish the requested level, activation event and final fill. They describe different stages of the order lifecycle.
Can your buy fill sit above the candle high?
A buy fill can sit above a bid candle’s high because the buy uses the ask. The bid candle does not record the ask high. First establish the chart basis, then compare the execution with the appropriate quote.
Can a stop activate when the candle does not touch it?
A stop can activate without the visible candle touching its level when the trigger uses a quote side absent from that chart. The specific trigger rule matters. Check the instrument’s order terms and the relevant bid or ask history.
Does a negative opening result prove slippage?
A negative opening result does not prove slippage. Buying at the ask and valuing an immediate sale at the bid reflects the spread before other applicable charges. Check the account’s valuation and fee treatment separately.
07. The VCG Markets lens
VCG Markets is an international multi-asset broker. Its reported activity includes 10M+ trades executed, $2T+ trading volume and access across 80+ countries. Those figures describe activity and reach. They do not explain an individual execution.
For an execution question, use the trade’s own evidence. Preserve the order identifier, instrument, direction, order type and timestamp. Then request clarification of the quote reference and any remaining difference.
The same distinction applies to trading technology. Chart analysis helps you inspect market movement. An execution record tells you what happened to an order. Neither should be used as a substitute for the other.
Your chart shows a price reference. Your trade record shows an execution. A useful review connects them without assuming they are identical.
FAQ
What causes the bid ask price chart difference?
The bid ask price chart difference often comes from comparing different quote sides. A buy normally uses the ask, while a bid chart displays the sell-side quote. Timing and execution conditions can create additional differences.
Why is my buy price higher than the price on my chart?
Your buy price can be higher because buying normally uses the ask while your chart may display the bid. Confirm the chart basis and compare quotes at the execution time before attributing the difference to slippage.
Is the price on a trading chart the price I can trade at?
The chart price is not automatically an executable price. It can represent bid, ask, last or midpoint data, and execution also depends on order instructions and market conditions.
What is the difference between spread and slippage?
Spread is the difference between simultaneous bid and ask quotes. Slippage is the difference between an execution and its relevant reference price. A chart-to-fill gap can involve either or both.
Why did my stop-loss activate when the chart did not touch it?
Your stop-loss can activate if its trigger uses a quote side that the chart does not display. Confirm the instrument’s trigger rules and inspect the relevant quote history at that time.
Does a limit order guarantee that my trade will execute?
A limit order does not guarantee execution. It restricts the acceptable execution price, but the order can remain unfilled when its conditions are not met.
What should I send support about an execution difference?
Send the order identifier, full instrument symbol, direction, order type and execution timestamp. Include the chart source and time zone so support can compare the same instrument and moment.
08. Conclusion
For your 2026 trade reviews, compare like with like. Match the instrument. Match the executable quote side. Match the time. Then investigate spread, slippage and order conditions as separate questions.
VCG Markets traders should retain the execution record before changing chart settings. Switching feeds or chart types changes the reference you are looking at. Preserve the original comparison so the question remains traceable.
One last thing: a candle high is the high of its underlying data stream. It is not automatically the highest ask, highest bid and highest transaction price together. That distinction is especially useful when a fill appears outside a candle.
Takeaway: identify what the chart measures before judging what the order received.
Related guides
This article is for educational purposes only and does not constitute investment advice. Trading CFDs and other leveraged products carries a high level of risk and may not be suitable for all investors.

معلومات
VCG Markets Ltd هي الكيان المرخص المخوّل بتقديم خدمات الاستثمار. وهي مسجلة في جمهورية موريشيوس (رقم الشركة 188485) ومرخصة ومنظَّمة من قِبل هيئة الخدمات المالية في موريشيوس بموجب رخصة رقم GB22200388، ومقرها الرئيسي في The Cyberaty Lounge، الطابق الأرضي، The Catalyst، Silicon Avenue، 40 Cybercity، 72201 Ebene، جمهورية موريشيوس.
VCG Markets (Seychelles) Ltd هي الكيان المرخص المخوّل بتقديم خدمات تعامل الأوراق المالية (Securities Dealer). وهي مسجلة في جمهورية سيشل (رقم الشركة 8438443-1) ومرخصة ومنظَّمة من قِبل هيئة الخدمات المالية في سيشل بموجب رخصة رقم SD243، ومقرها الرئيسي في House of Francis، Room 301(B)، Ile Du Port، Mahe، جمهورية سيشل.
يدير الموقع VCG Tech Limited (رقم الشركة HE452446)، ومقرها الرئيسي في Agias Fylaxeos & Zinonos Rossidi، 2، الطابق الأول، 3082 ليماسول، قبرص. تعمل VCG Tech Limited بوصفها الشركة التجارية المسؤولة عن معالجة إيداعات العملاء وسحوباتهم.
تداول الفوركس والعقود مقابل الفروق بالهامش منتجات ذات رافعة مالية وقد تؤدي إلى خسائر تتجاوز إيداعاتك. قد تنخفض قيمة الاستثمارات كما قد ترتفع، وقد تسترد أقل مما أودعته في الأصل. يُرجى التأكد من فهمك الكامل للمخاطر المعنية والنظر في مدى ملاءمة هذا النوع من التداول لك.
قد يتم تسجيل المكالمات الهاتفية والاتصالات الإلكترونية ومراقبتها لأغراض ضمان الجودة والامتثال والتدريب.
المعلومات الواردة على هذا الموقع مقدَّمة للأغراض الإعلامية العامة فحسب، ولا تُشكّل نصيحة استثمارية أو توصية أو دعوة للانخراط في أي نشاط استثماري.
لا تقدّم VCG Markets أي استشارات ضريبية. قد تتغير التشريعات الضريبية أو تختلف بين الولايات القضائية.
المعلومات الواردة على هذا الموقع غير موجَّهة إلى المقيمين في الولايات المتحدة الأمريكية أو بلجيكا أو كندا أو سنغافورة، أو أي دولة يكون الوصول إلى هذه المعلومات فيها مخالفاً للقوانين أو اللوائح المحلية.
جميع الحقوق محفوظة. VCG Markets © 2026, Inc

يمكنك متابعتنا على


